Gold Price Forecast: XAU/USD Brights And Surpasses $2000 Amid Mixed US Economic Data

Image Source: Pixabay
- Gold climbs 0.61% to $2003.50, buoyed by falling US Treasury yields and uncertain economic indicators.
- January's Retail Sales fall 0.8%, highlighting economic volatility amid poor weather affecting auto and gasoline sales.
- Fed's cautious inflation outlook and lower CPI than forecast weaken the Dollar, boosting gold's appeal.
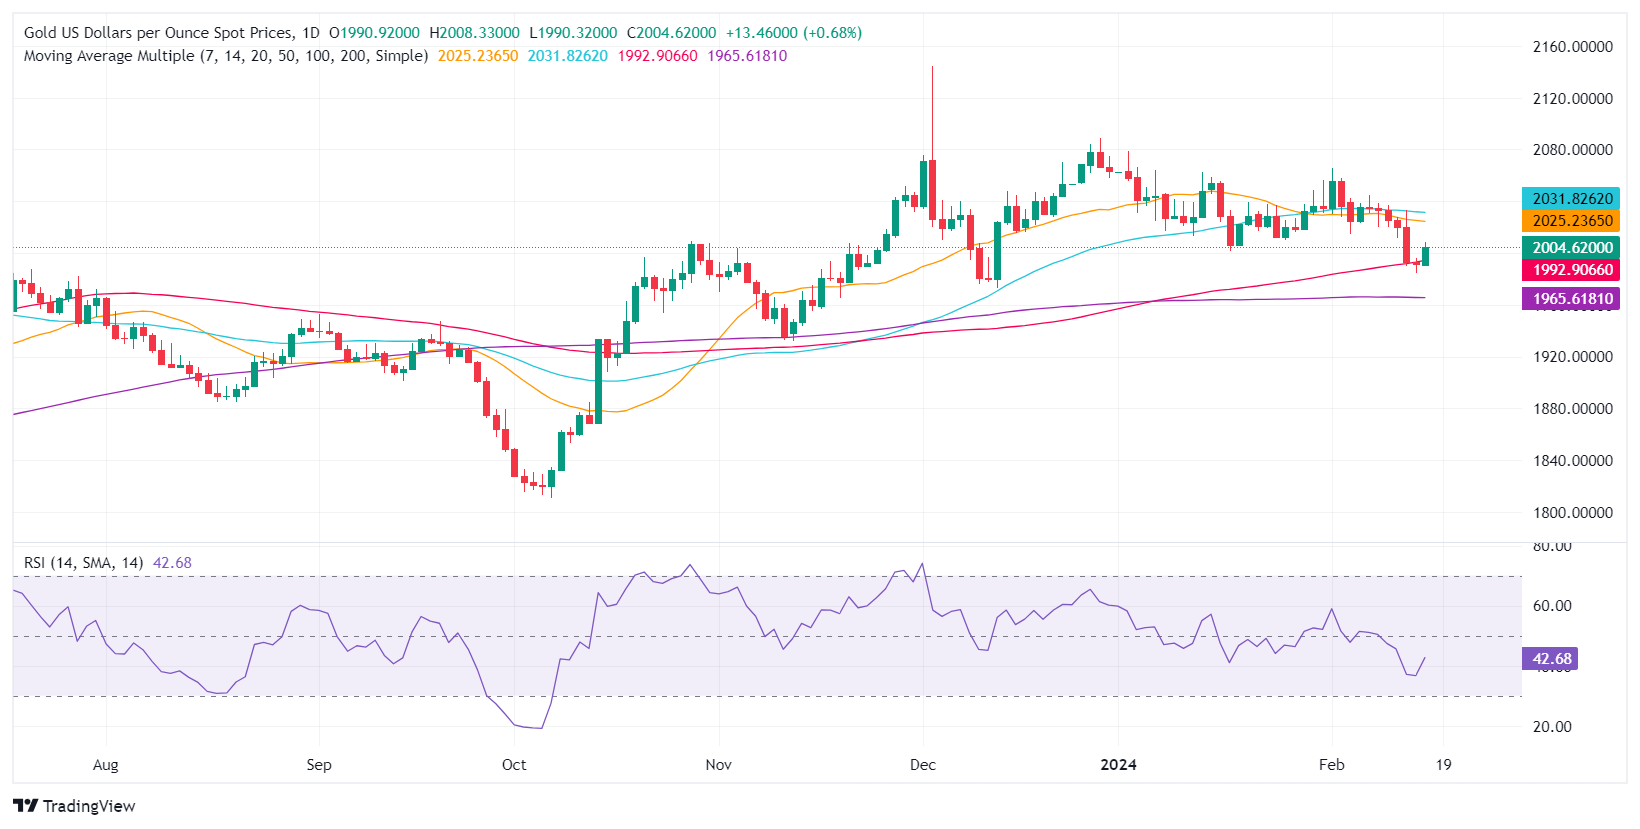
Gold price recovered some ground on Thursday, as it reclaimed the $2000 mark due to falling US Treasury bond yields. A tranche of mixed US economic data weighed on the Greenback. Therefore, the XAU/USD posted gains of 0.61%, but as the Asian session begins, it trades at $2003.50.
Mixed US economic data and lower US Treasury yields boost Gold’s appeal
The latest data from the United States was mixed. Retail Sales for January saw a decrease of -0.8% month-over-month, falling short of both the previous month's figures and the estimated -0.1% contraction. This decline was largely attributed to reduced sales at auto dealerships and gasoline service stations, with stormy weather conditions further dampening sales.
Concurrently, Initial Jobless Claims for the latest week came at 212K, lower than both the forecasts and the previous week's reading of 220K. This comes as a somewhat unexpected development, given that claims were anticipated to increase following announcements of layoffs by several companies.
On Thursday, US Treasury bond yields lost two basis points and finished at 4.236%, while the US Dollar Index (DXY) dropped 0.41% to 104.28.
In the meantime, Federal Reserve Vice-Chairman for Supervision Michael Barr crossed the wires on Wednesday. He said that the path to 2% inflation would be ‘bumpy’ following the latest US inflation report. On Tuesday, the Consumer Price Index (CPI) came in at 3.1% YoY, below the previous reading of 3.4%, but missed estimates of 2.9%.
XAU/USD Price Analysis: Technical outlook
Gold price is neutral to downward biased, even though the yellow metal trades above the 200-day moving average (DMA). From a price action standpoint, Gold has achieved successive series of lower highs and lows, opening the door for further downside. However, sellers must reclaim the 100-DMA at $1996.01, which could open the door to test the December 13 low of $1973.13, followed by the 200-DMA at $1965.41. Conversely, if buyers push prices above the 50-DMA at $2031.80, Gold could aim towards the February 1 high at $2065.60.
XAU/USD
| OVERVIEW | |
|---|---|
| Today last price | 2004.89 |
| Today Daily Change | 13.73 |
| Today Daily Change % | 0.69 |
| Today daily open | 1991.16 |
| TRENDS | |
|---|---|
| Daily SMA20 | 2025.24 |
| Daily SMA50 | 2031.83 |
| Daily SMA100 | 1992.91 |
| Daily SMA200 | 1965.62 |
| LEVELS | |
|---|---|
| Previous Daily High | 1996.17 |
| Previous Daily Low | 1984.26 |
| Previous Weekly High | 2044.63 |
| Previous Weekly Low | 2014.92 |
| Previous Monthly High | 2079.01 |
| Previous Monthly Low | 2001.9 |
| Daily Fibonacci 38.2% | 1988.81 |
| Daily Fibonacci 61.8% | 1991.62 |
| Daily Pivot Point S1 | 1984.89 |
| Daily Pivot Point S2 | 1978.62 |
| Daily Pivot Point S3 | 1972.98 |
| Daily Pivot Point R1 | 1996.8 |
| Daily Pivot Point R2 | 2002.44 |
| Daily Pivot Point R3 | 2008.71 |
More By This Author:
Canadian Dollar Finds Some Room After Us Retail Sales Miss Overshadows Canadian Home Sales DeclineUSD/JPY Drops To Near 150.00 As USD Index Falls Ahead Of US Retail Sales Data
EUR/USD Extends Gains To Near 1.0730 On Improved Risk Appetite, US Retail Sales Eyed
Disclosure: Information on this article contains forward-looking statements that involve risks and uncertainties. Markets and instruments profiled on this page are for informational purposes ...
more


