Gold Price Forecast - The Calm Before The US Election Storm
GOLD (XAU/USD) ANALYSIS, PRICE AND CHART
- The US dollar’s reaction to the election will drive the precious metal.
- US real yields are becoming less negative, a bearish signal for gold.
- Retail traders remain heavily long of the precious metal.
With just a few days to go before the 59th US presidential election on November 3, incumbent Donald Trump is said to be trailing the Democratic candidate Joe Biden in the polls, and in the all-important state of Florida. Bookmaker Paddy Power has Biden at 2/5 to win the election while Trump is available at a much more generous 15/8. The final couple of days before the vote, and the days after it, will likely be highly charged and this volatility will reach across all financial markets. Gold will remain under the spell of the US dollar, and safe-haven flows, and will likely see choppy trading conditions as markets gyrate between risk-on and risk-off.
The price of gold has dipped recently alongside a small pick-up in US real yields. At the start of the month, gold printed a high of $1,913/oz. while US real yields were negative 95 basis points. Today US real yields have moved 10bps higher to negative 85 basis points while gold has fallen to a current level around $1,884/oz. Gold receives a boost the further US real yields turn negative and the precious metal turns lower if US real yields turn less negative.
Gold’s inverse relationship with the US dollar remains but it is being tested. The weaker US dollar of late has failed to boost the price of the precious metal, while safe-haven flows, another traditional prop for gold, seem to be having a limited effect. The US dollar has picked up a small bid this week and this is likely to remain the case as we head into the election.
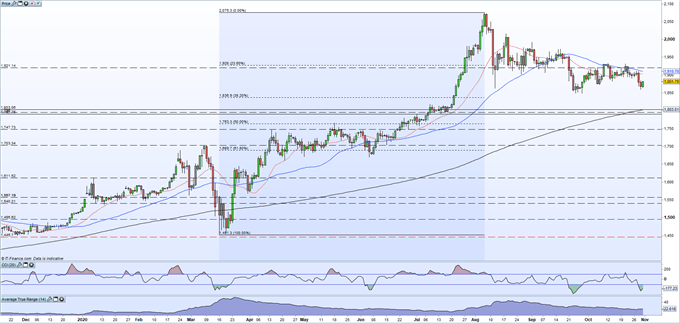
From a trader’s perspective, it may be wise to stand back and let the US election play out before committing to the market. When the election result, and the composition of the Senate, is known then the path ahead for gold will be clearer and less fraught. In the short-term, there seems to be support between $1,848/oz. and $1,837/oz. off the double lows in September and the 38.2% Fibonacci retracement, although this may not hold if volatility picks-up next week.
GOLD DAILY PRICE CHART (DECEMBER 1999 – OCTOBER 30, 2020)
GoldBEARISHData provided by IG
| CHANGE IN | LONGS | SHORTS | OI |
| DAILY | -3% | -9% | -4% |
| WEEKLY | -5% | -7% | -5% |
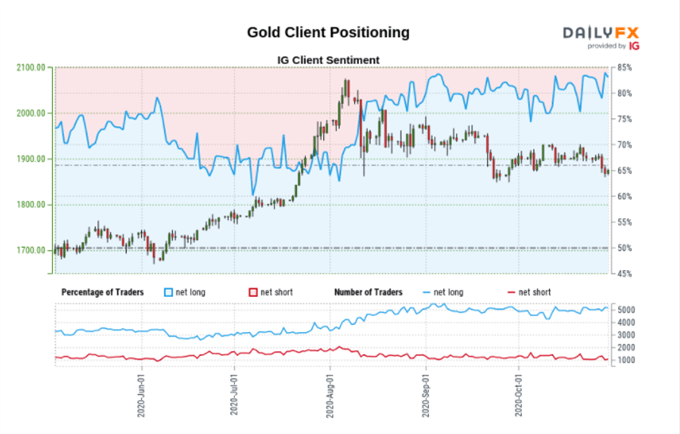
IG retail trader datashow 82.36% of traders are net-long the precious metal. We typically take a contrarian view to crowd sentiment, and the fact traders are net-long suggests Gold prices may continue to fall.
Positioning is less net-long than yesterday but more net-long from last week. The combination of current sentiment and recent changes gives us a further mixed Gold trading bias.
Disclosure: See the full disclosure for DailyFX here.


Interesting article, Thanks.