Gold Price Forecast: Real Yields Weighing On Precious Metals
Gold price action has stabilized since last week’s sharp selloff. The precious metal sank nearly 7% from its year-to-date high of $1,963 and invalidated its breakout above $1,900. Surging Treasury yields, and corresponding US Dollar strength, stand out as the primary driver of recent gold volatility.
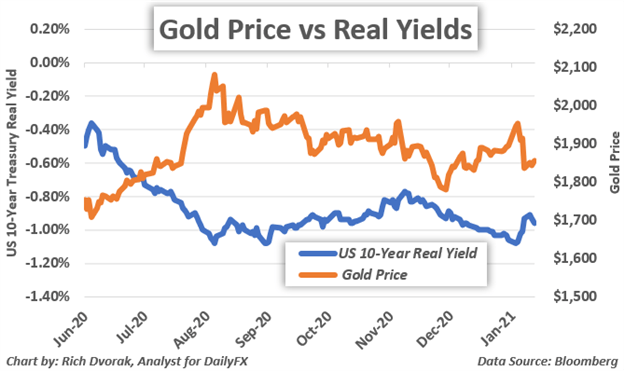
GOLD PRICE CHART WITH 10-YEAR US REAL YIELD OVERLAID: DAILY TIME FRAME (JUN 2020 TO JAN 2021)

On the back of ‘high price tag’ stimulus plans expected from president-elect Biden, however, future inflation expectations seem to be accelerating higher. This is likely helping steer real yields tick back lower. Not to mention, with Federal Reserve Chair Powell reiterating the central bank’s uber-accommodative stance today, coupled with robust demand for long-term Treasuries at auctions earlier this week, there is potential for Treasury yields to face notable headwinds more broadly.
A scenario where Treasury yields struggle to extend their sharp advance and inflation expectations continue to rise could recharge the broader bullish gold thesis. This is considering the generally strong inverse relationship between gold prices and the direction of real yields. That said, another leg higher in real yields would likely weigh negatively on gold price action.
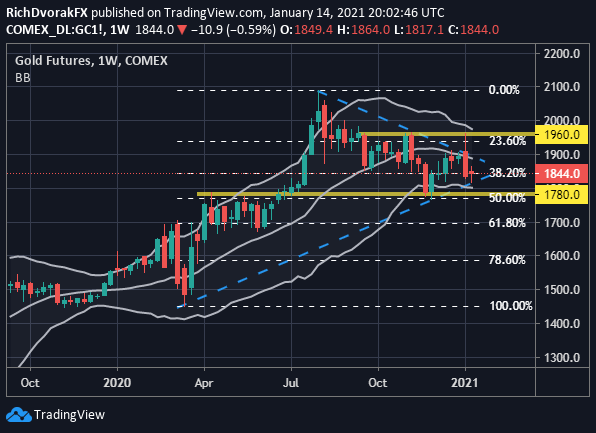
GOLD PRICE CHART: WEEKLY TIME FRAME (SEP 2019 TO JAN 2021)

Chart by @RichDvorakFX created using TradingView
Turning to a weekly gold chart we can see that the latest selloff found technical support near its long-term bullish trendline connecting the March 2020 and November 2020 swing lows. Gold prices now look stuck between $1,780-1,960 roughly highlighted by the mid-point and 23.6% Fibonacci retracement of last year’s trading range. Breaching this lower technical barrier may tee up a deeper pullback toward the $1,700-price mark, though the bottom Bollinger Band could help stymie potential selling pressure. On the other hand, eclipsing the November 2020 swing high might motivate gold bulls to set their sights back on all-time highs.
Disclosure: See the full disclosure for DailyFX here.


Good analysis, thanks.