
Gold Price Forecast: Gold Threatens Larger Break, 1854 Support In Sight
Gold prices started off the week with another aggressive sell-off. Last Monday marked the May open for Gold and the yellow metal slid down for a fresh two-month-low before finding some support at prior resistance, taken from the swing at 1854.
That price at 1854 remains relevant: This was the swing high in January and it showed as resistance briefly in February, before prices gapped through in the middle of that month, eventually building three days of support at that spot before the bullish trend extended.
But, after helping to set support on Monday and Tuesday of last week, sellers pushed down there for a test to start this week. And that’s leading to a strong rebound as US markets come online for the week. This puts the focus back on short-term resistance, with levels at 1878 remaining of interest. Beyond that, we have a zone that was in play for resistance on Friday from 1888-1891. And if the bulls can push beyond that, then the same 1900-1923.70 zone comes back into play, which continued to carry pull-over price action through last week, with the 1908 level coming in to help set last week’s high.
Gold Two-hour Price Chart
(Click on image to enlarge)
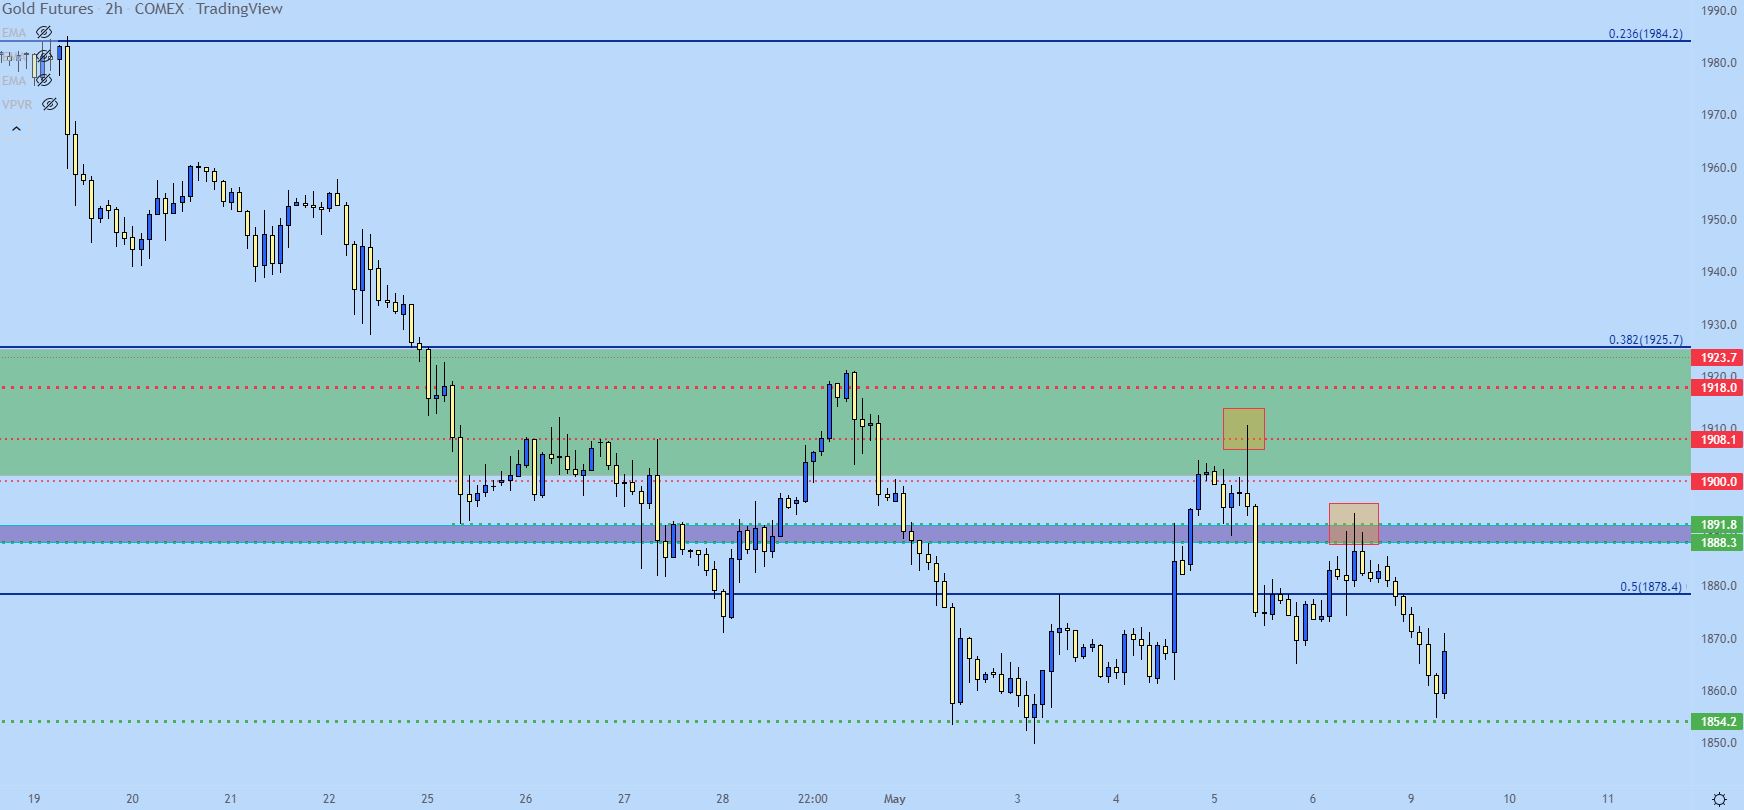
Chart prepared by James Stanley; Gold on Tradingview
Gold Bigger Picture
Taking a step back to the daily chart highlights the importance of this 1854 level. Prior resistance has played in as fresh support and sellers have so far remained fairly persistent after this level has come into play.
But, perhaps more enticing than the support hold itself is the potential move if it gives way, as the next spot of support is down around the 1831 area, after which a prior swing from 1810 comes into play. And longer-term support is down around 1783, which keeps the door open for sizable potential on the short side if sellers can retain control of longer-term price action.
Gold Daily Price Chart
(Click on image to enlarge)
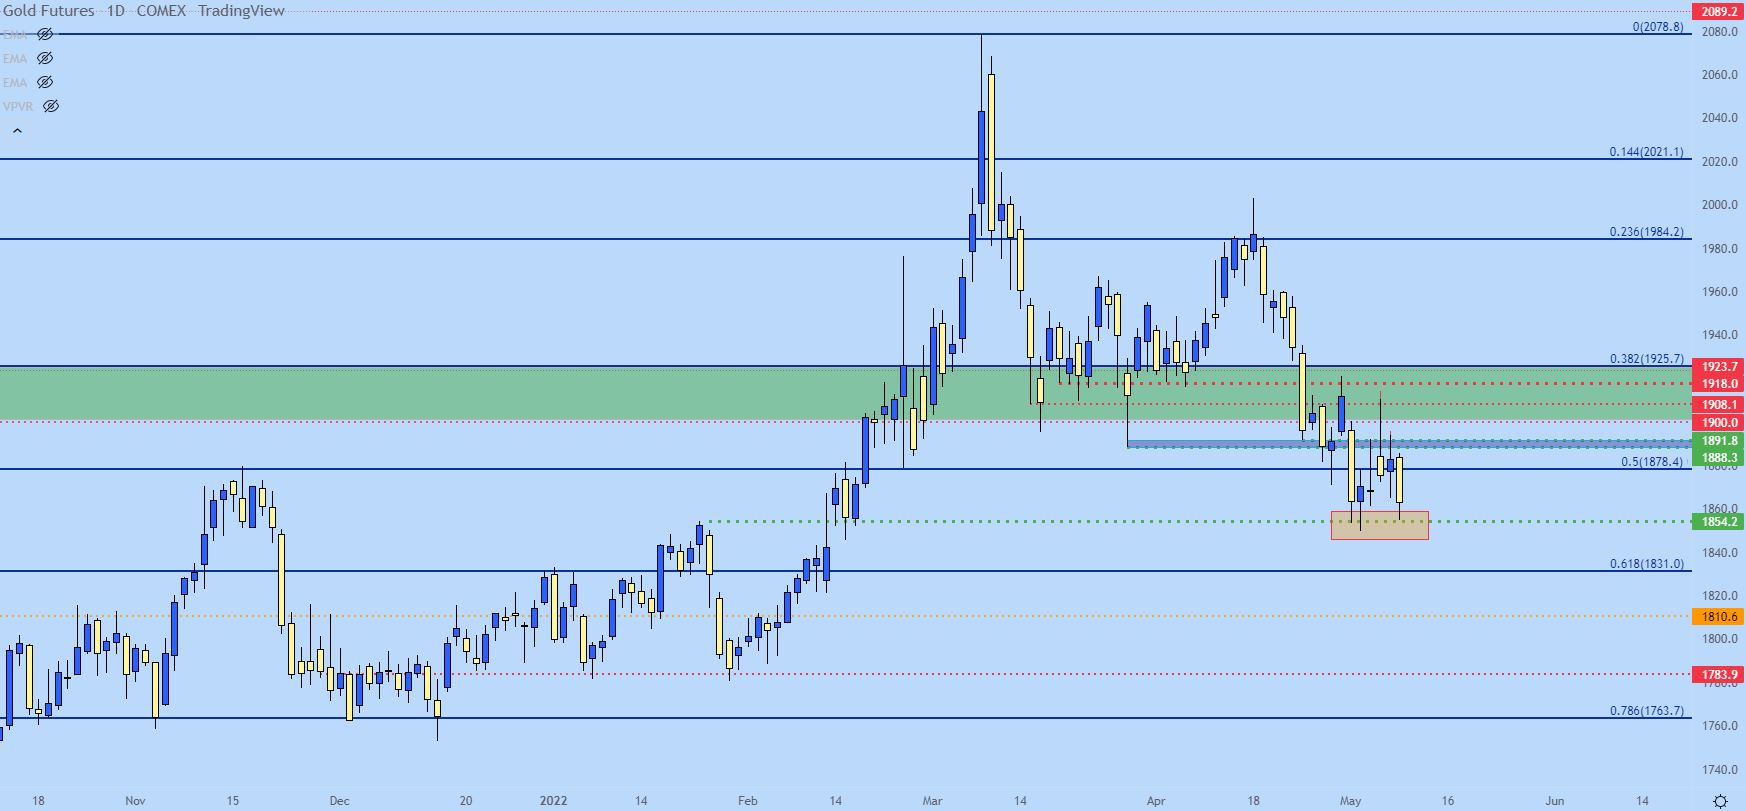
Chart prepared by James Stanley; Gold on Tradingview
Gold Longer-Term: Trendline Nearing
Taking a further step back on the Gold chart and there’s another item of interest. There’s a bullish trendline that, for this week, projects to around 1846. For Gold bulls, hold at this level would be key to keeping the door open for topside strategies. This trendline connects swing lows from last August and this January, and that projection is close to coming into play and if sellers continue to drive, it’ll likely come into the picture this week.
Gold Weekly Price Chart
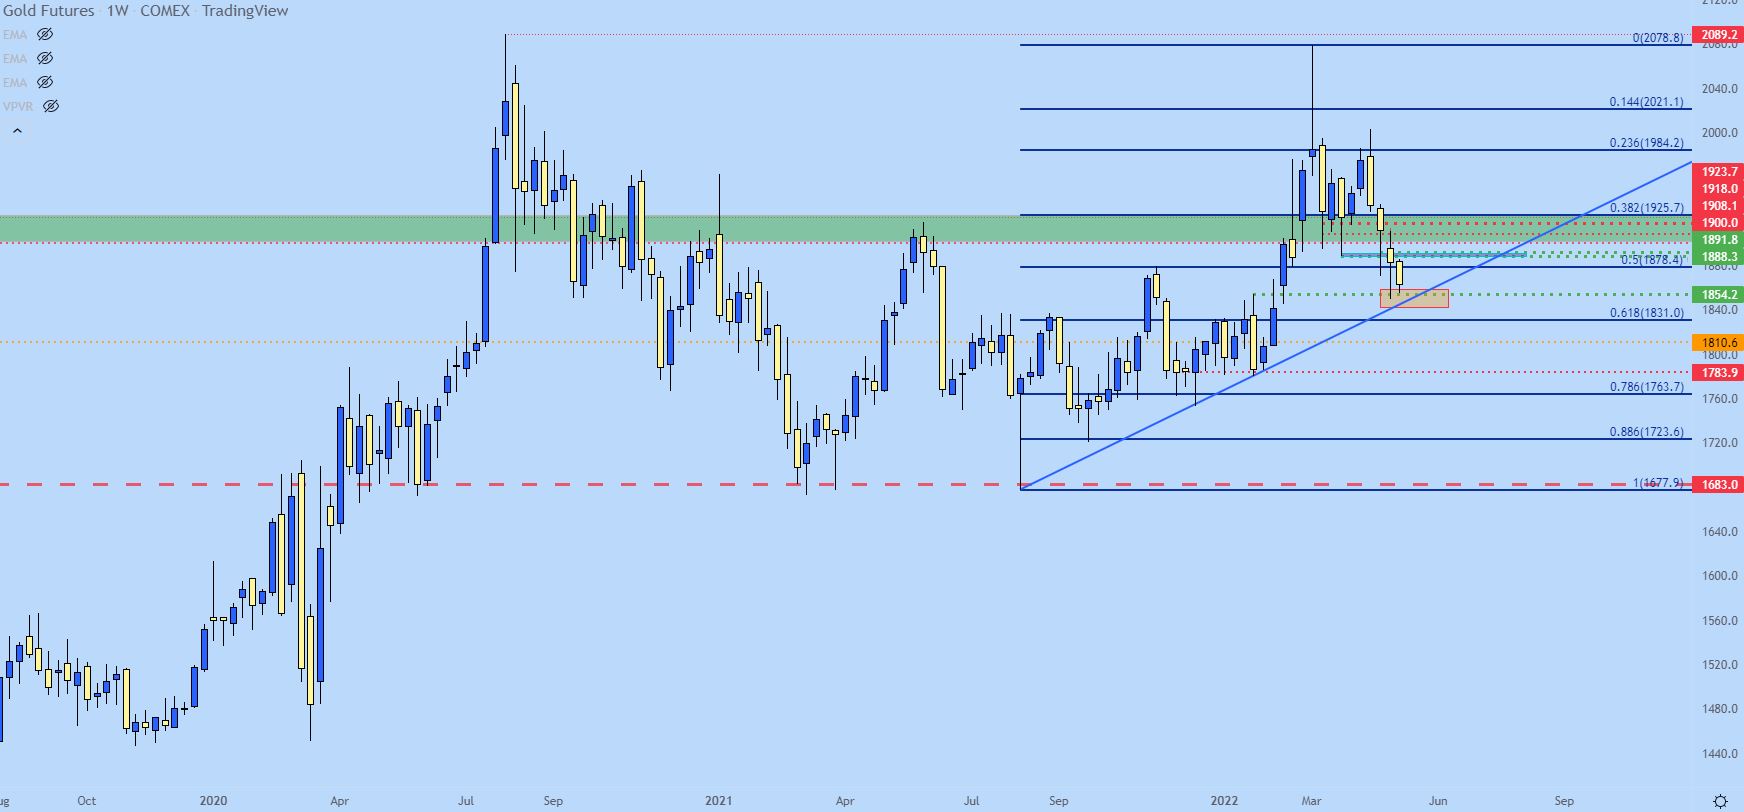
Chart prepared by James Stanley; Gold on Tradingview
Disclosure: See the full disclosure for DailyFX here.


