

The year started with a flare of excitement for Gold prices as bulls made a fast run at the all-time high in Q1. This would’ve seemed unthinkable last year as Gold had continued to grind in a support zone that looked as though it could give way and this ran from around 1670-1700. But, as Russia readied tanks for the invasion of Ukraine Gold prices started to perk up and as the war began, Gold prices spiked up to test that all-time high that was set in the summer of 2020.
Bulls came up a little shy of taking out that all-time high in February and that’s around the time that another theme began to take over, and that was an aggressive run of USD strength as marked prepared for a more hawkish FOMC. In March, an evening star formation built on the weekly chart and that marked the top for that bullish theme.
After testing above the 2k psychological level in early April, Gold prices had fallen all the way down to 1622 by September, and that’s when bulls started to dig in their heels. That support held two more tests in October while price action built into a falling wedge and since then, the bullish reversal has been pushing prices higher and that leads us into today’s test of five-month highs.
Gold Weekly Price Chart
(Click on image to enlarge)
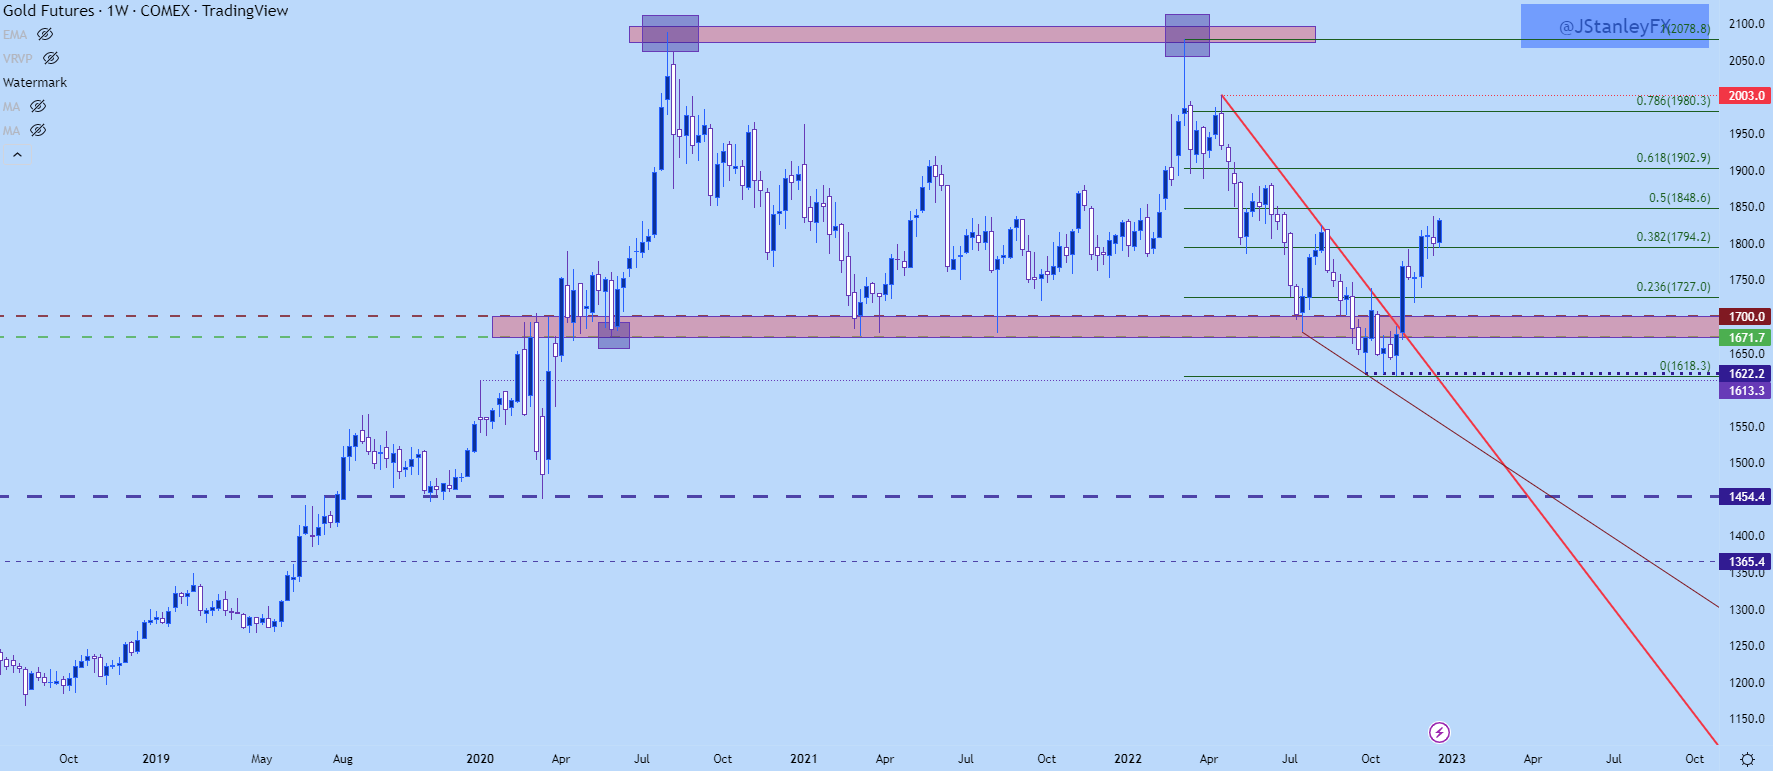
Chart prepared by James Stanley; Gold on Tradingview
GOLD INTERMEDIATE TERM
Focusing in on more recent price action, the past two weeks have been indecisive for Gold, even amidst some heavy event risk and some significant moves elsewhere, such as equities. But, bulls haven’t yet folded, helping to hold support at a key spot last week. And then to open this week, we saw a hold at a higher-low, thereby keeping the door open for bulls.
If buyers are able to push to a fresh high the next area of resistance sits just overhead, plotted at 1848 which is the 50% mark of the 2022 bearish move. This is a big decision level for the trend and if buyers can continue the break beyond that level, bigger-picture bullish scenarios can start to come into play.
Gold Weekly Price Chart
(Click on image to enlarge)
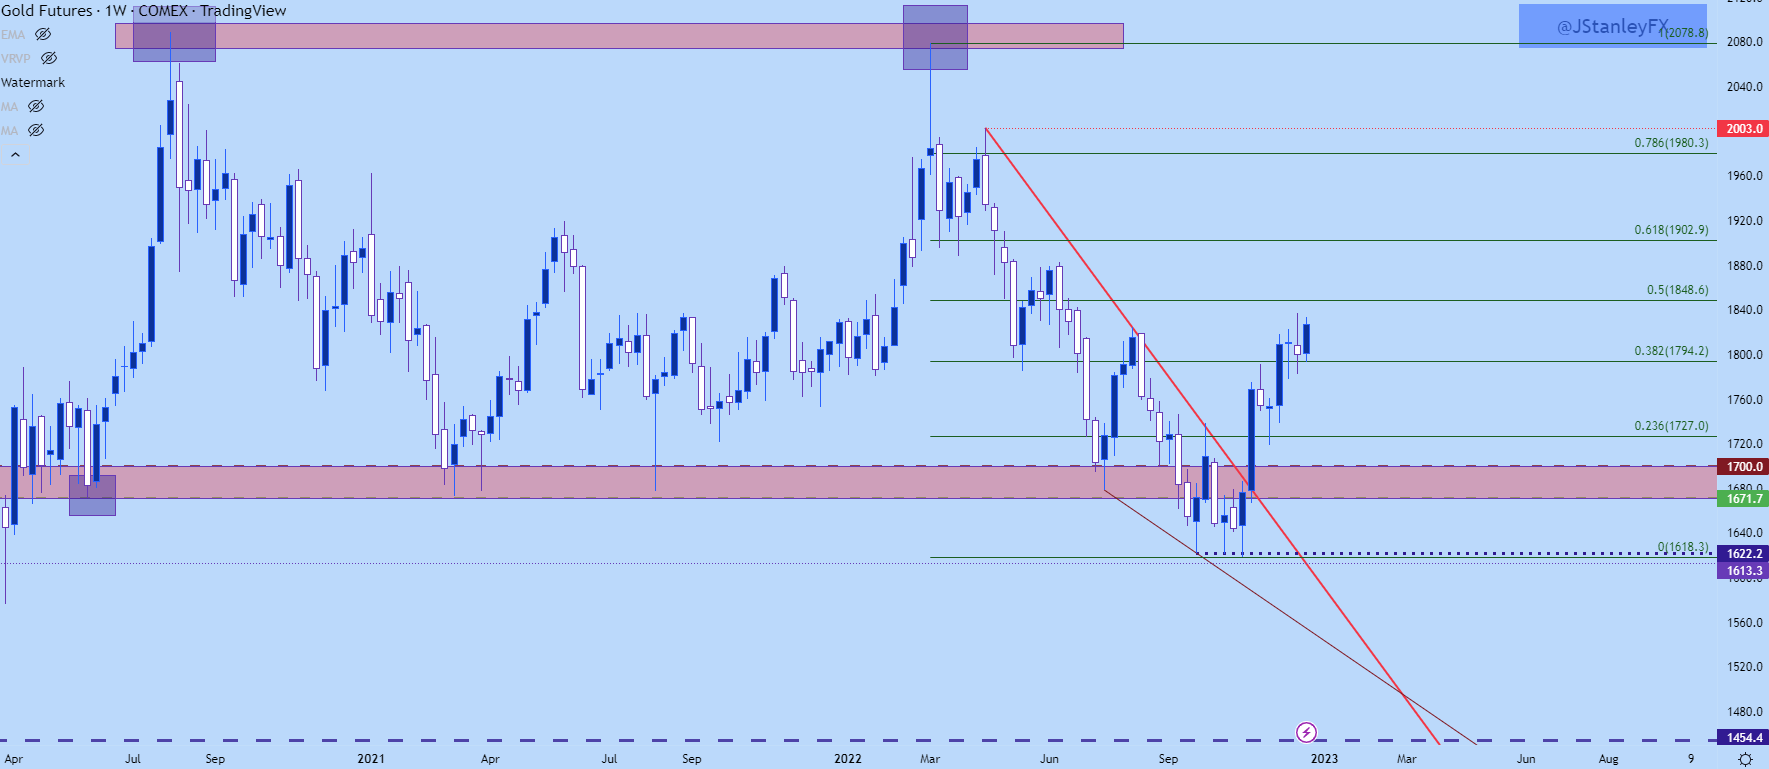
Chart prepared by James Stanley; Gold on Tradingview
GOLD SHORT-TERM
On a shorter-term basis, there’s a zone of resistance that I’ve been tracking taken from the prior August highs. This has been one of the factors leading to that two weeks of indecision that we’ve seen, and I’ve been following that around the 1825 level which buyers have currently tested above. This test is still early, however, and it would be presumptuous to assume at this early point that it may hold as higher low support. But, if it does, the topside breakout remains as a setup and the current five-month-high at 1836 is vulnerable. If buyers can force a push above that, the 1848 level sits overhead and I’m expecting a significant test there at the halfway point of this year’s bearish move.
Gold Daily Price Chart
(Click on image to enlarge)
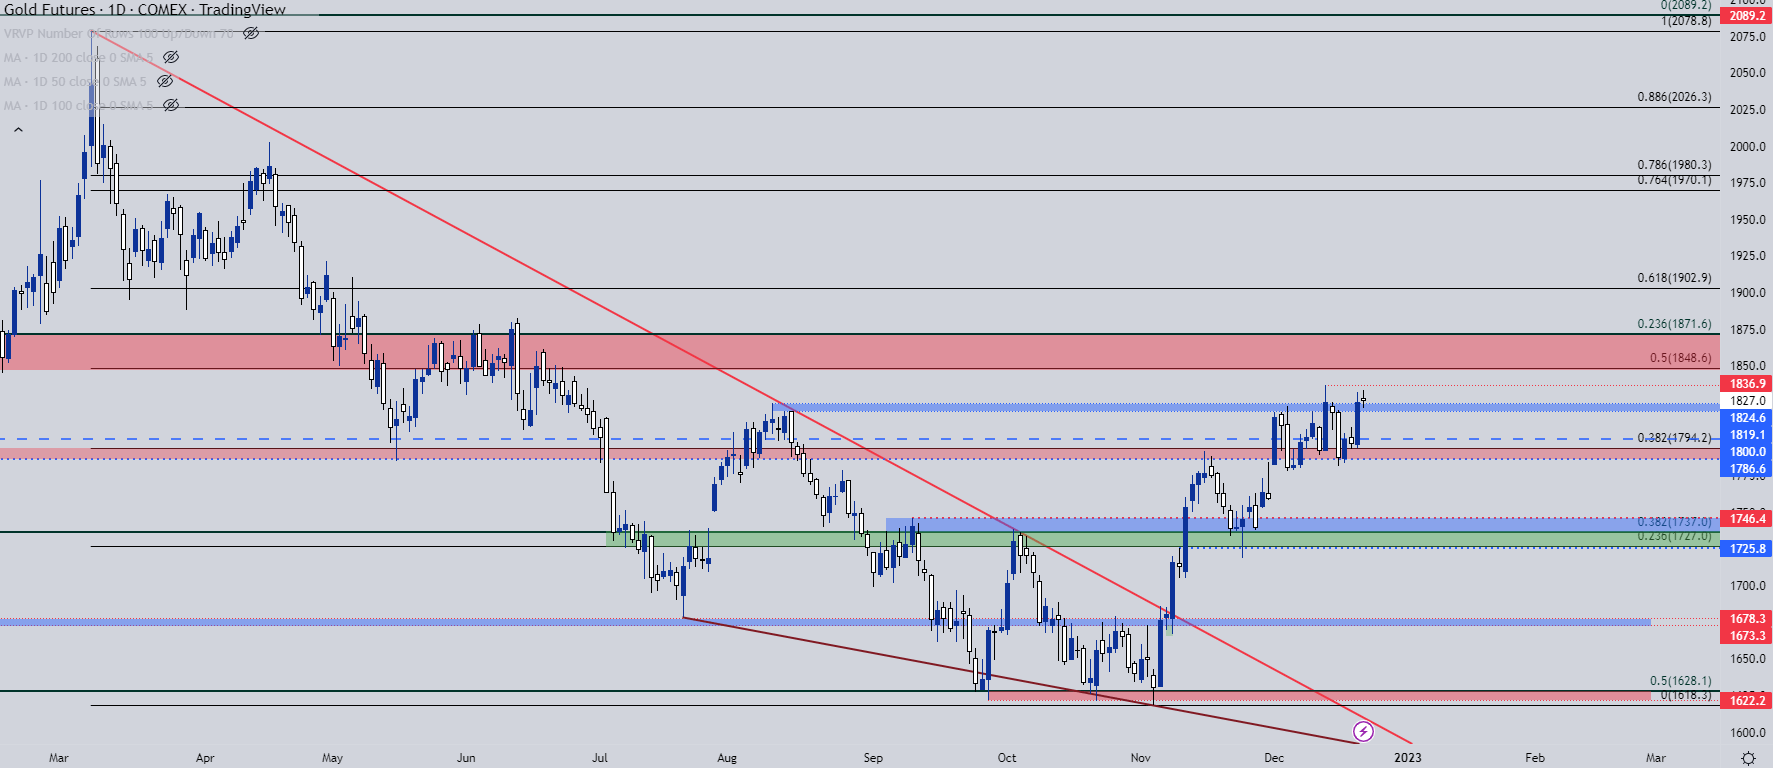
Chart prepared by James Stanley; Gold on Tradingview
More By This Author:
Japanese Yen Price Action Setups: USD/JPY, EUR/JPY, GBP/JPY
Canadian Dollar Price Action Setups - USD/CAD, CAD/JPY, EUR/CAD
US Dollar Price Action Setups: EUR/USD, GBP/USD, AUD/USD, USD/CAD


Comments
Log in or sign up to join the conversation.