

Gold prices have started the week with a bounce which, given the way last week went, is a bit of reprieve for bulls. Gold prices have been falling for over a month now, following the build of a rising wedge pattern in June that led to a strong and decisive bearish breakdown.
That breakdown finally started to find a bit of support last week at the psychological level of 1700, and as looked at in this week’s Technical Forecast, that can keep the door open for a bit of a bounce. The first zone of interest for that theme is already in-play, spanning from Fibonacci levels at 1723 and 1733.
GOLD TWO-HOUR PRICE CHART
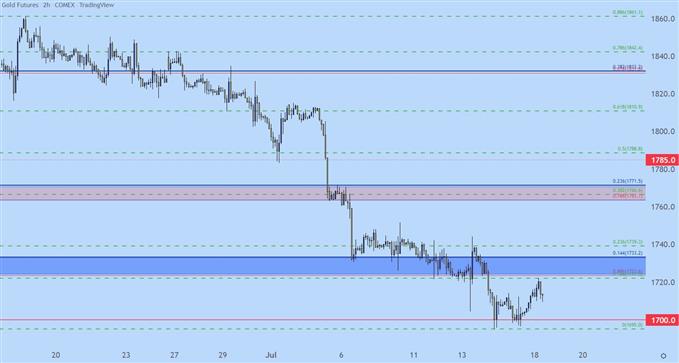
Chart prepared by James Stanley; Gold on Tradingview
GOLD HOLD NEAR THE LOWS
Taking a step back on Gold and there’s scope for further recovery, largely on the basis of how minor this bounce has been so far. This morning’s bounce has been just a 14.4% move in the bearish trend that started in June. The 38.2% retracement of that move, however, rests in the zone that runs from 1763-1771, and this seems a reasonable area to look to for lower-high resistance in bigger-picture continuation themes, if the bounce does persist.
GOLD DAILY PRICE CHART
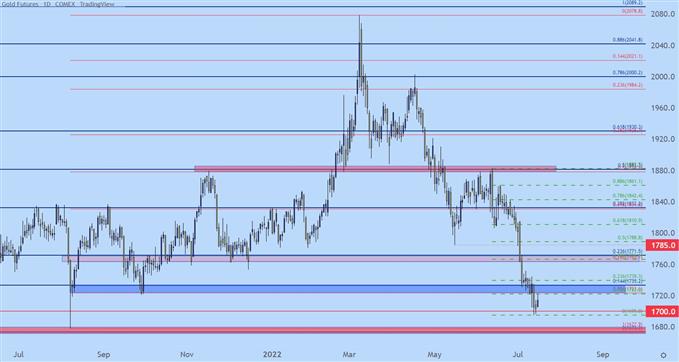
Chart prepared by James Stanley; Gold on Tradingview
GOLD SHORTER-TERM
I kept the technical forecast for Gold at neutral for this week, and that’s largely on the basis of the primary trend appearing to be at a pause point. A five-week sell-off is encouraging for sellers, but with price angling up to support around two-year-lows, a clean breach didn’t seem probabilistic enough to retain a bearish forecast.
But, with that said, it does appear as though there’s some counter-trend potential for this week and that can keep the door open for a move up to lower-high resistance for longer-term themes. From the four-hour chart below, I point out a couple of additional areas to look to for shorter-term themes, and there’s a level around 1739 and a zone from 1751-1753.
And, as an alternative approach – the potential for bearish breakouts does remain in the event that sellers can take-out 1695 in short-order. In that even, follow-through support shows up at the two-year-low of 1680 for short-term breakout strategies.
GOLD FOUR-HOUR PRICE CHART
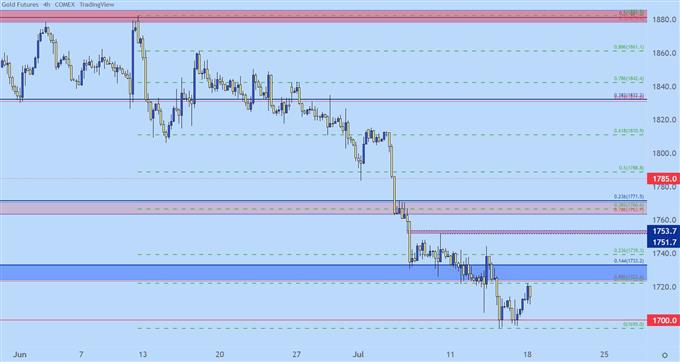
Chart prepared by James Stanley; Gold on Tradingview
More By This Author:
S&P 500 Recovery, Goldman Sachs, Bank of America EarningsDefining Week For The Euro: ECB Lift-Off, CPI And Bond Market Jitters
Crude Oil Update: Brent Propped Up By Uneventful Biden Trip And Uncertainty Around Nord Stream


Comments
Log in or sign up to join the conversation.