

Global markets have had glimpses of being unmoored ever since the FOMC rate decision last Wednesday. The collapse in the British Pound is probably the most notable event so far, but the movement that’s shown in US rates is difficult to ignore and at this point it seems that there’s disconnect between stocks and bonds (and FX). And that’s saying a lot considering that stocks are grasping at key support levels. But, the moves in FX have been extreme and we haven’t quite seen that yet in US equities. Nor have we really even seen that yet in gold, at least not in my opinion.
As rates were running higher last week, gold did break down to a fresh two-year-low. I had warned of this last Monday as gold was bristling at that key support. And as I wrote in that article, gold prices were threatening a larger break and that potential still remains.
Last week’s break triggered a double top formation, which is often approached with the aim of bearish breakdowns, positing that prices have already-topped. This would also seem to sync with the fundamental environment and given the amount of time that the formation took to set up and complete, the bearish move that would be projected by the formation could be rather large, pointing to the possibility of a longer-term move down towards the $1250 area of the chart.
Gold Monthly Price Chart
(Click on image to enlarge)
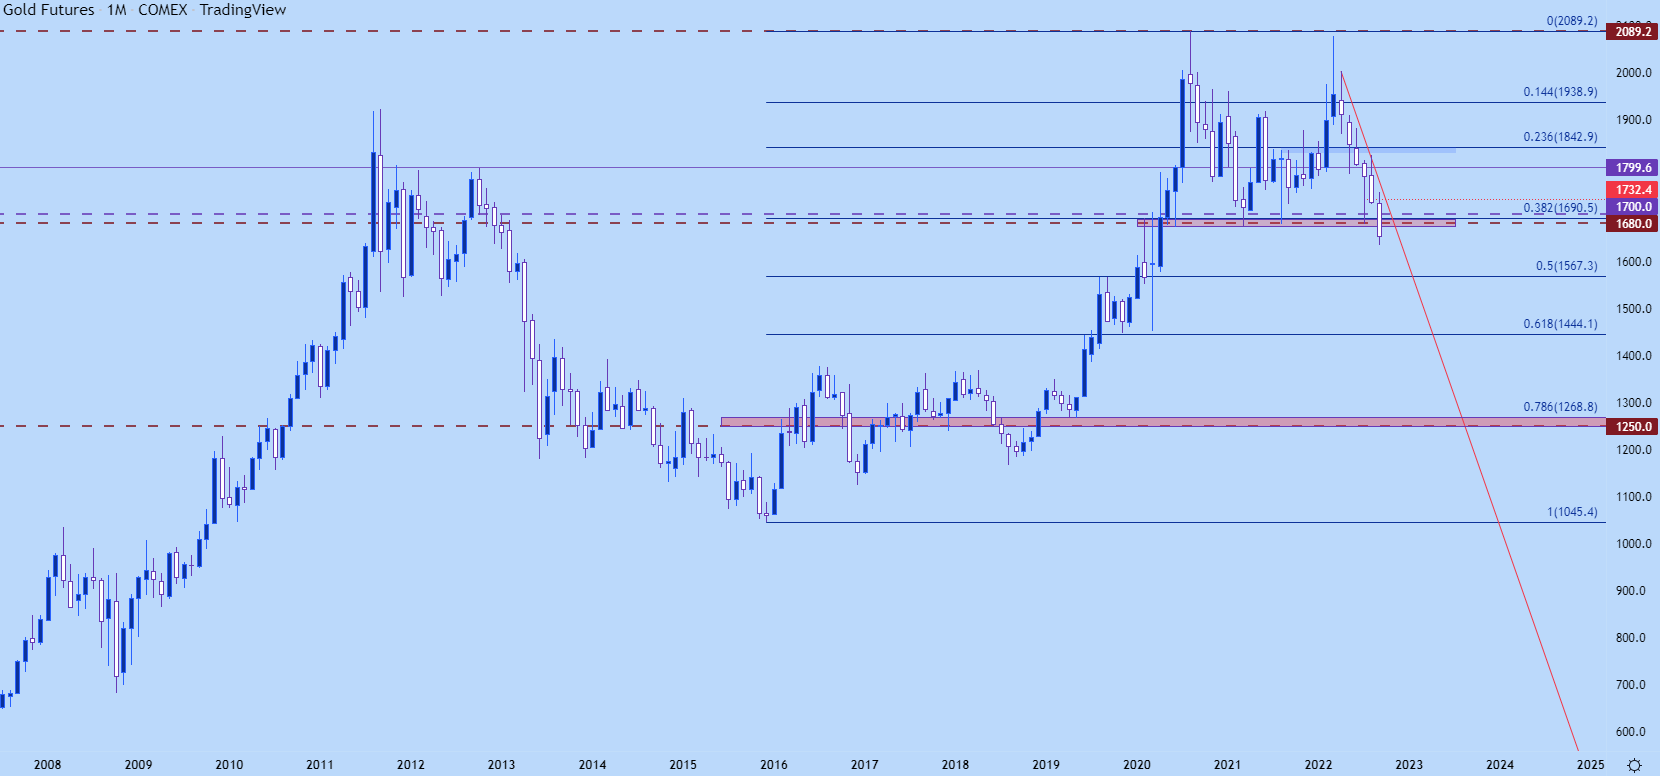
Chart prepared by James Stanley; Gold on Tradingview
GOLD: FROM BIG PICTURE DOWN
From the monthly chart above we can see where gold is working on its sixth consecutive month of losses. Basically since February, when gold prices flared on the Russian invasion of Ukraine, prices have been selling off in gold.
And while that event has probably had something to do with it, there’s been another major factor growing more and more prominent since March – and that’s the Fed’s hawkish plans, which have only heated up throughout the year.
Last week brought the most recent installment from the Fed when Chair Powell, again, pledged to fight inflation as a top priority. Markets seem to be growing more and more familiar with this message as Powell has remained somewhat consistent since his Jackson Hole speech.
And ever since that speech, gold prices have been getting hammered.
On the daily chart below, I’ve drawn a red box around the August 26th candle, and notice the continuation of lower-lows and lower-highs that’s printed since then.
Gold Daily Price Chart
(Click on image to enlarge)
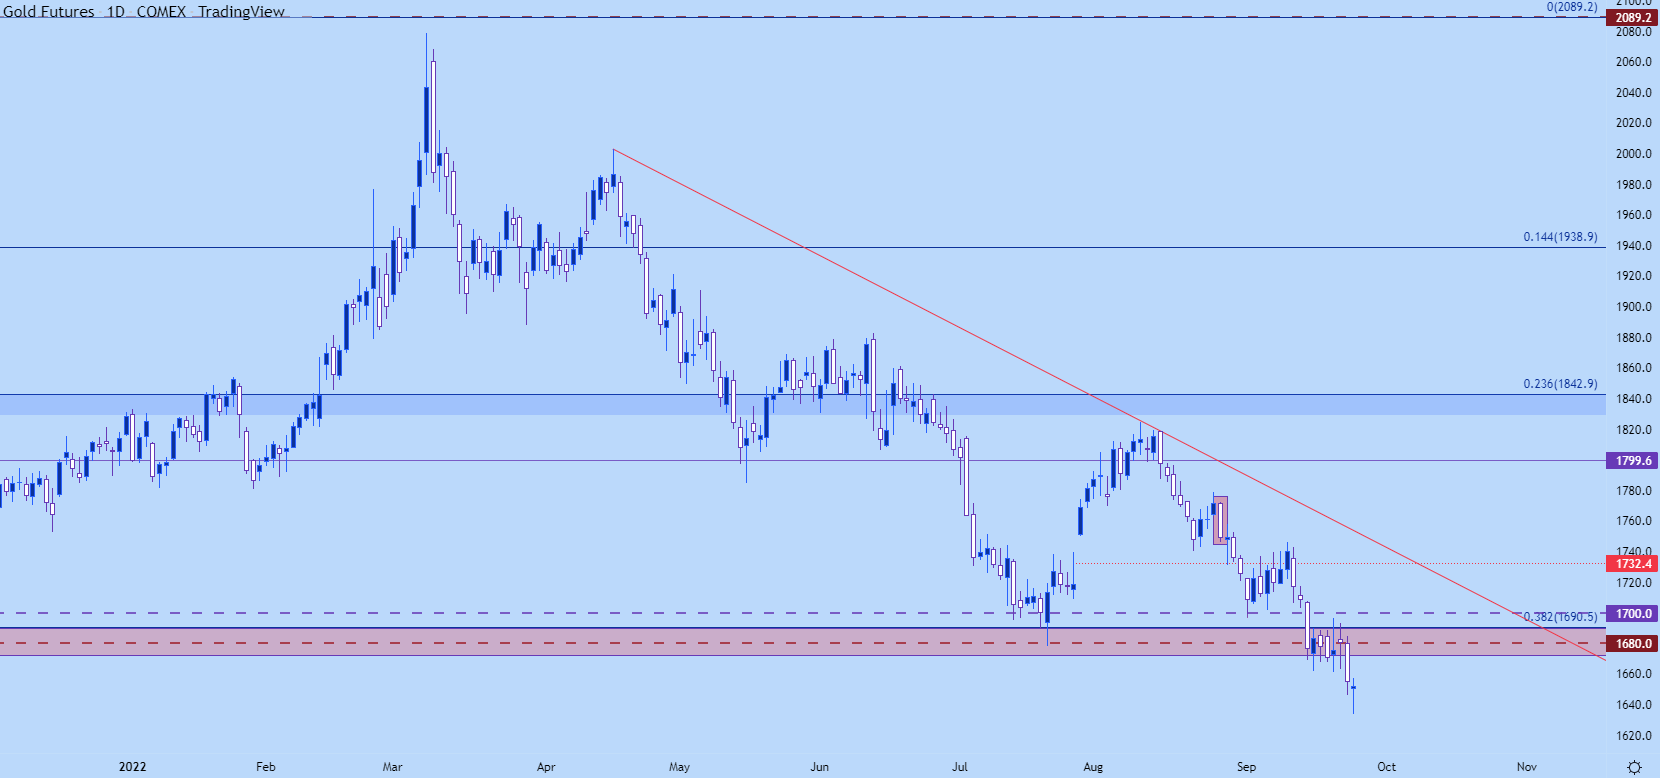
Chart prepared by James Stanley; Gold on Tradingview
GOLD NEAR-TERM
Selling at support can be challenging for a couple of reasons. And for gold bears that’s been especially perilous, even during this downside run. Gold has exhibited support at 1700 and then again around 1662.
This helps to expose a number of prior supports that become of interest for lower-high resistance potential. For aggressive strategies, that 1662 level is very nearby. A little higher, 1680 remains of interest and above that, there’s a Fibonacci level at 1690 and then the 1700 psychological level – which had put-in a big spot of support on September 1st, before price retraced for most of the next two weeks. A test of the psychological level would also have the luxury of trading through a number of recent swing-highs, which would likely trigger a number of stops on short positions.
Gold Four-Hour Chart
(Click on image to enlarge)
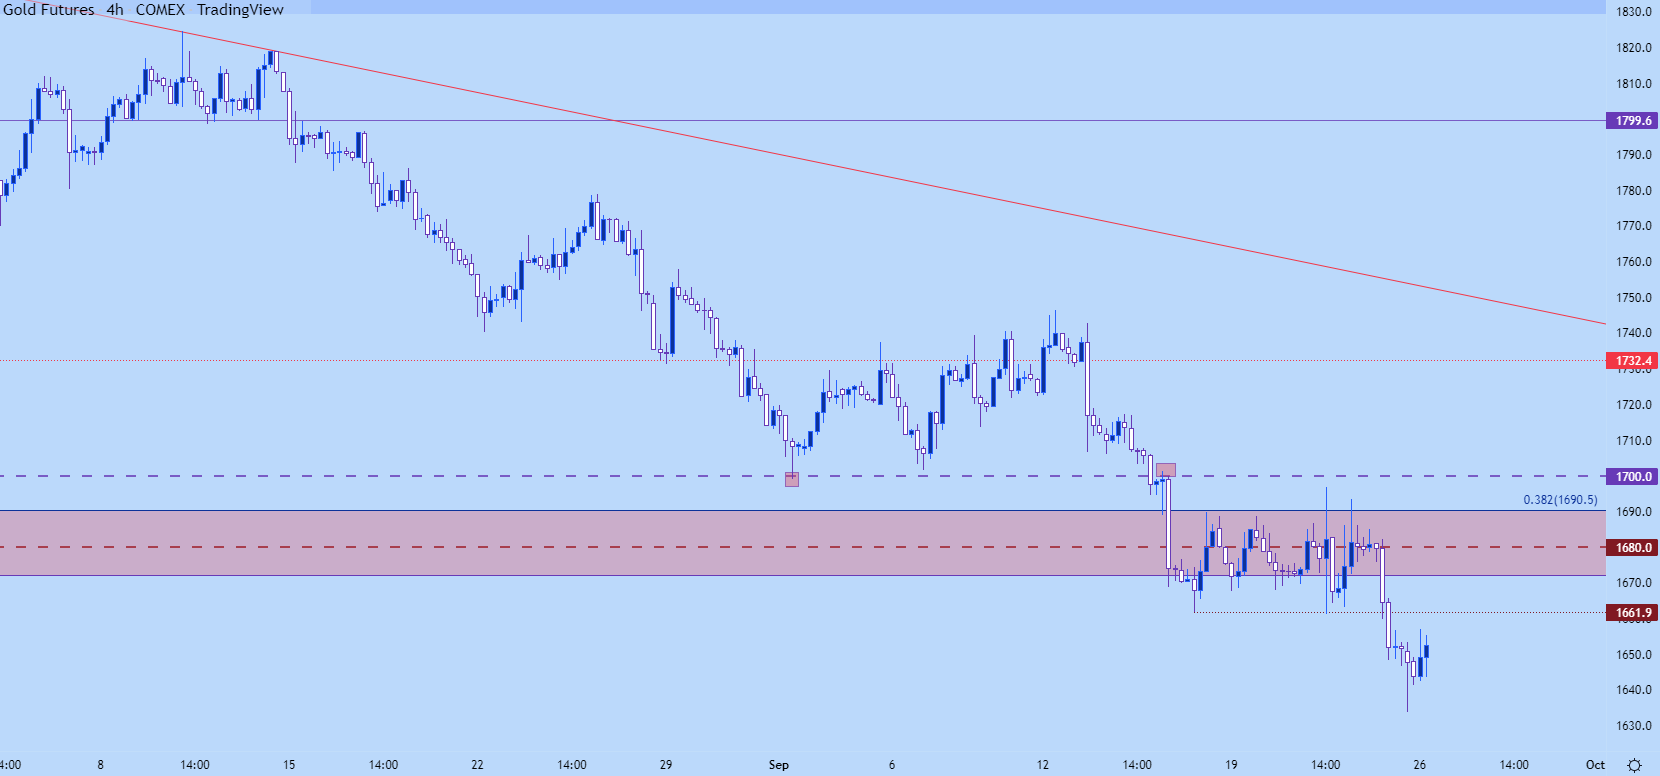
Chart prepared by James Stanley; Gold on Tradingview
More By This Author:
British Pound (GBP) Forecast: Pound On The Ropes As Economic Plan Puts PM Truss At Odds With The BoEUS Dollar Price Action Setups: EUR/USD, GBP/USD, USD/CHF, USD/JPY
SPX, Nasdaq, USD: Delayed Boom, 'Pain,' After September FOMC


Comments
Log in or sign up to join the conversation.