Gold Price Forecast: Gold Bears Push Break Ahead Of The Fed - XAU/USD Levels

Over the past year we’ve heard about rapidly escalating inflation and despite the fact that the Fed has continued to say that it’s ‘transitory,’ inflation growth has yet to abate. And in some areas, it appears to be getting more worrisome as we’ve even started to hear corporates warning and lowering guidance due to supply chain constraints. Snapchat, a company that sells virtually zero physical product themselves, warned in last week’s earnings call that advertisers are less active because they simply have less product to sell, a pretty clear sign that inflation is perhaps less ‘transitory’ than the Fed had initially hoped.
This is highly pertinent in Gold, which can perform very well in a stagflation-like environment. Expectations for such can build when you have strong inflation and meager growth, similar to what was indicated by this week’s Advance GDP read showing a 2% annualized growth rate. But we’re not there yet and we may not get there, it really depends on how the Fed handles this rather difficult situation that’s begun to build, and we’ll hear more about that next week.
In Gold, the fear is rate hikes. Rate hikes can draw capital away from non-interest bearing assets such as Gold or Silver. The more hawkish the Fed is, the more bearish Gold can become; but it’s often a game of anticipation as one could see by analyzing Gold charts from 2012-2015, a period in which the Fed was readying markets for the eventual return of higher rates. The Fed hiked for the first time in nine years in December of 2015, and perhaps not coincidentally, this is when Gold bottomed, highlighting the importance of anticipation around rates themes when analyzing Gold markets.
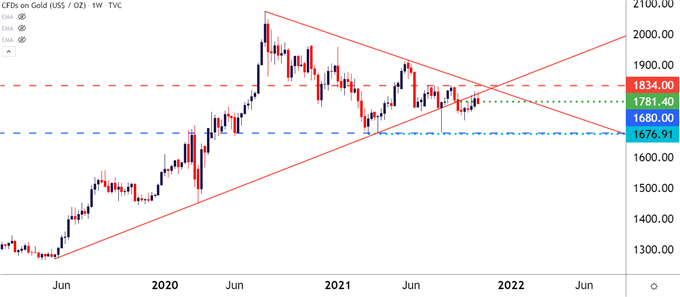
With that in mind, it makes sense as to why Gold topped in August of last year, right around the time that US rates bottomed. And as rates markets have continued to price-in the prospect of eventual rate hikes, Gold prices have been biased to the downside. From the weekly chart below, we can even see the build of a bearish formation with the descending triangle. This is illustrated with a show of horizontal support to go with lower-high resistance, highlighting the potential for a bearish break at some point in the future.
GOLD WEEKLY PRICE CHART

Chart prepared by James Stanley; Gold on Tradingview
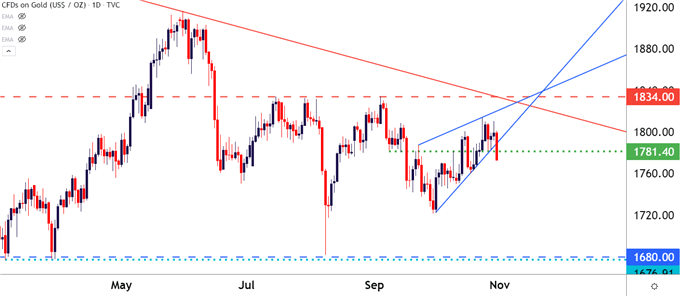
Shorter-term, matters get a bit messier. One item that is clear at this point are key levels, with 1834 resistance and 1676/1680 support. The latter zone has been tested thrice so far this year as support, each time producing a hold with a bounce. The 1834 resistance level has similarly been tested thrice this year, most recently in early September right after a 1680 support test. Outside of that, there’s a lot of projection that’s required just because of how much noise has been showing of recent, with numerous short-term trends developing inside of this longer-term digestion.
On a more near-term basis, this week saw continued grind at the underside of a longer-term trendline projection. But there was also a rising wedge that had built through October, a formation often approached with the aim of bearish price action. That’s started to fill in with Gold’s Friday push down to a fresh weekly low.
GOLD DAILY PRICE CHART

Chart prepared by James Stanley; Gold on Tradingview
GOLD STRATEGY NEAR-TERM
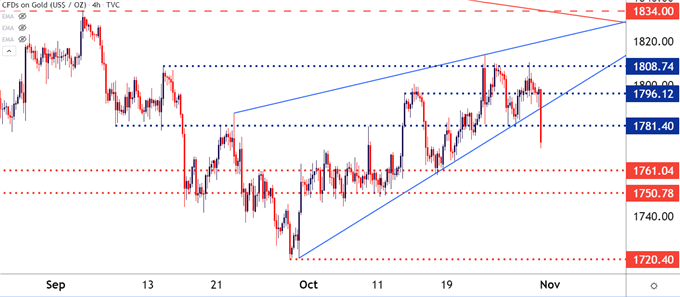
As shown in the very first chart in this article, near-term trends have been fairly short-lived over the past few months, so chasing a move or a recent breakout can be challenging. Trends can be challenging near-term, so breakout or reversal approaches may be more amenable to the jagged price action recently displayed on short-term charts.
On the below four-hour chart I’ve added three levels underneath price action and three above. A breach of a closed bar on the four-hour or above chart opens a door for a move up/down to the next level, and if 1720 is broken, 1680 comes into the equation.
GOLD FOUR-HOUR PRICE CHART

Chart prepared by James Stanley; Gold on Tradingview
Disclaimer: See the full disclosure for DailyFX here.


