Gold Price Forecast Could Turn Bullish Above This Key Level
Gold prices broke through symmetrical triangle support last week, on the way to fresh 2019 lows in recent days. While the Easter holiday-week may have offered a reprieve, the factors that led to a deterioration in Gold’s appeal as a safe haven, have started to return to the field of play. If anything, the fundamental picture for Gold prices is mixed for the very near-term.
For Gold bulls, a sharp deterioration in risk appetite seems unlikely, given that US equity markets continue to press forth to fresh all-time closing highs. Similarly, the upcoming Q1’19 US GDP report looks like it should shake off fears of an imminent recession. Finally, with the DXY Index pushing to a fresh 2019 high, a strong US Dollar makes for a difficult environment in which Gold prices could rally.
On the other hand, as was noted in the weekly Gold fundamental forecast, global growth expectations are front and center once again (particularly out of Europe), while Brexit headlines have started to reemerge in the newswires. An EU-US trade war revolving around agriculture may be brewing. Gold bears may not be able to press their luck much further given these lingering concerns.
GOLD PRICE TECHNICAL FORECAST: DAILY CHART (APRIL 2018 TO APRIL 2019) (CHART 1)
(Click on image to enlarge)

Earlier this month it was noted that “A move below the April low of 1280.80 would be a significant development in the days ahead and suggest that Gold prices may see a deeper setback towards the rising trendline from the August, September, and November 2018 lows near 1260 by the end of the month.”
Yesterday, Gold prices bottomed out near 1266, or about 0.5% away from the aforementioned trendline support; further downside appears to be limited, particular as the end of the month approaches. Only a breach of 1260 would suggest that the technical structure has turned increasingly bearish.
If the Gold technical outlook is going to revert from its bearish bias following the symmetrical triangle breakdown last week, the first necessary condition would be to get back above one key level: the daily 8-EMA at 1279. In the process of doing so, Gold prices would return back above the early-January/initial 2019 low around 1276.51.
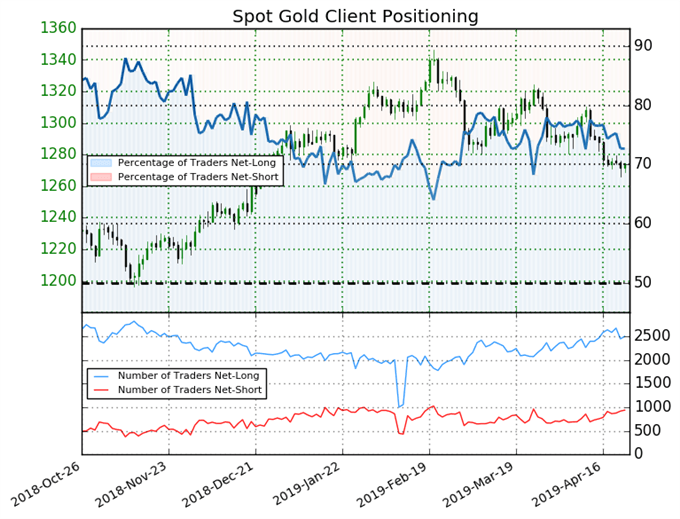
IG CLIENT SENTIMENT INDEX: SPOT GOLD PRICE FORECAST (APRIL 24, 2019) (CHART 2)

Spot Gold: Retail trader data shows 72.7% of traders are net-long with the ratio of traders long to short at 2.66 to 1. The number of traders net-long is 7.8% lower than yesterday and 2.0% lower from last week, while the number of traders net-short is 2.5% higher than yesterday and 6.6% higher from last week.
We typically take a contrarian view to crowd sentiment, and the fact traders are net-long suggests Spot Gold prices may continue to fall. Yet traders are less net-long than yesterday and compared with last week. Recent changes in sentiment warn that the current Spot Gold price trend may soon reverse higher despite the fact traders remain net-long.


Nice article. It helped me to see better why gold is bearish. Thank you.
Are you still bearish on gold?
What's your take on gold now?