
Gold Price Flirting With Potential Breakout Above $1,900
Gold price action has staged a healthy rebound attempt over recent trading sessions. The precious metal has climbed roughly 5% since the start of December in an effort to end its losing streak of four-months straight. Gold prices currently hover slightly beneath the psychologically-significant $1,900-level, which so far has kept sustained advances at bay. This area of technical resistance looks likely to be challenged, however, as short-term bullish and medium-term bearish trend lines converge.
GOLD PRICE CHART: DAILY TIME FRAME (14 JUL TO 28 DEC 2020)
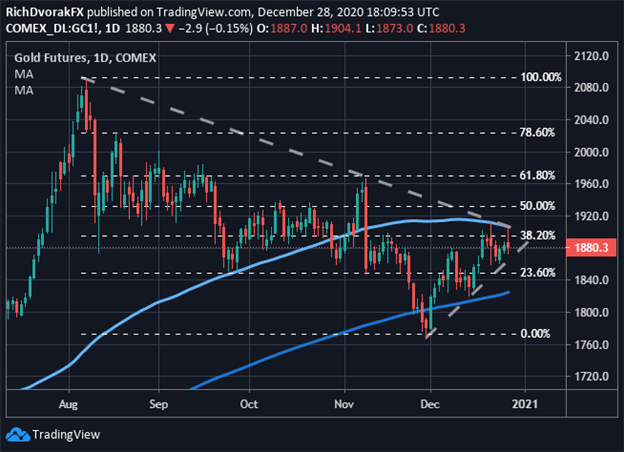
Chart by @RichDvorakFX created using TradingView
Gold prices have advanced steadily since bulls reclaimed the positively-sloped 200-day simple moving average. Defending this key technical level seems to have sparked the resumption of buying pressures corresponding with a string of higher lows and higher highs. That said, eclipsing the critical barrier of resistance around $1,900 could recharge gold bulls. This potential breakout level might tee up a heartier push toward the 61.8% Fibonacci retracement level of the trading range developed since August.
GOLD PRICE CHART WITH US DOLLAR INDEX OVERLAID: DAILY TIME FRAME (NOV 2019 TO DEC 2020)
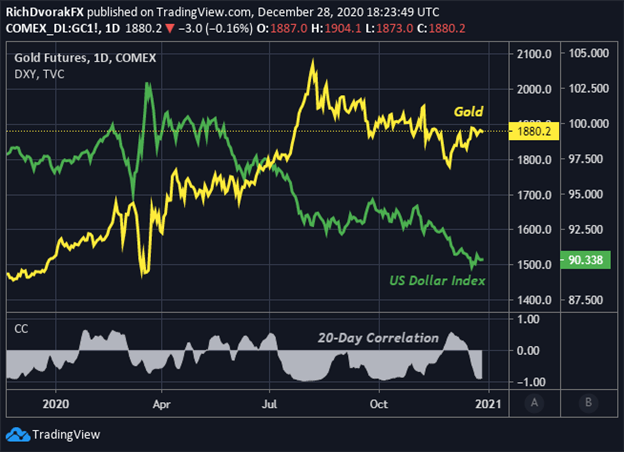
Chart by @RichDvorakFX created using TradingView
Perhaps another leg lower notched by the US Dollar could fuel a stronger rebound by precious metals. Gold price action generally maintains a strong inverse relationship with the US Dollar Index as indicated by their 20-day correlation. To that end, gold and silver prices could face renewed headwinds if a reversal by the US Dollar starts to materialize.
Disclosure: See the full disclosure for DailyFX here.


