

Image Source: Pixabay
Gold price prints modest losses on Thursday after economic data from the United States portrays the US economy as solid based on strong employment figures. Business activity continues to expand despite cooling off from an earlier hot streak, while the Minutes of the latest Federal Reserve’s (Fed) monetary policy meeting signaled that policymakers are in no rush to slash rates. The XAU/USD trades within the $2,020-$2,024 area, down by 0.06%.
XAU/USD traders remain entertained by a busy economic docket in the US. The US Bureau of Labor Statistics (BLS) revealed that unemployment claims for the latest week dropped compared to the one ending on February 10. At the same time, S&P Global revealed mixed February Flash PMIs, which remained in expansionary territory, fortifying the case that the US Federal Reserve (Fed) should keep rates higher for longer.
In the meantime, US Treasury bond yields are rising on the short end of the curve, a signal that investors remain skeptical that the Fed would cut rates in the March or May meetings. The latest Federal Open Market Committee (FOMC) minutes emphasized the US central bank is highly committed to tackling inflation even though economic risks are skewed to the downside. Policymakers emphasized that they would decide to ease policy via a data-dependent approach.
The FOMC Minutes showed Fed officials remain hesitant to cut rates too soon while adding they did not see it appropriate to lower interest rates until they gained “greater confidence” in core inflation moving sustainably toward 2%. Even though policymakers acknowledged that the risks of achieving both mandates is more balanced, they remained “highly attentive” to inflationary risks, even though economic risks are skewed to the downside.
Daily digest market movers: Gold retraces as traders see the Fed holding rates higher
- US Initial Jobless Claims for the week ending February 17 fell by 12,000 to 201,000, coming in under the anticipated 218,000 and the prior week's figure of 213,000. This drop indicates a continued tightness in the labor market, which is generally interpreted as a potential factor that could drive inflation upward.
- Business activity in the US moderated in February, as reported by S&P Global. Both the Services and Manufacturing Purchasing Managers Index (PMI) remained in the expansionary zone, indicating growth. However, the Services PMI recorded a figure of 51.3, falling short of both expectations and January's results, while the Manufacturing PMI rose to 51.5, surpassing forecasts and the previous month's 50.7. Consequently, the Composite Index, which aggregates the performance of both sectors, declined slightly from 52 to 51.4.
- The CME FedWatch Tool sees traders expect the first 25 bps rate cut by the Fed in June 2024.
- Investors are pricing in 95 basis points of easing throughout 2024.
- The US Dollar Index, tracking the performance of the US Dollar against a basket of six major currencies, is currently trading at around 103.98, down 0.01%.
- The Federal Reserve Vice-Chair Philip Jefferson said that he’s looking to a broad set of indicators, before deciding to cut interest rates. Despite disregarding giving a timetable of when the US central bank would begin to ease monetary conditions, he remains optimistic about the Fed bringing inflation toward its 2% target.
Technical analysis: Gold trades within familiar levels, capped by the 50 and 100-day SMA
(Click on image to enlarge)
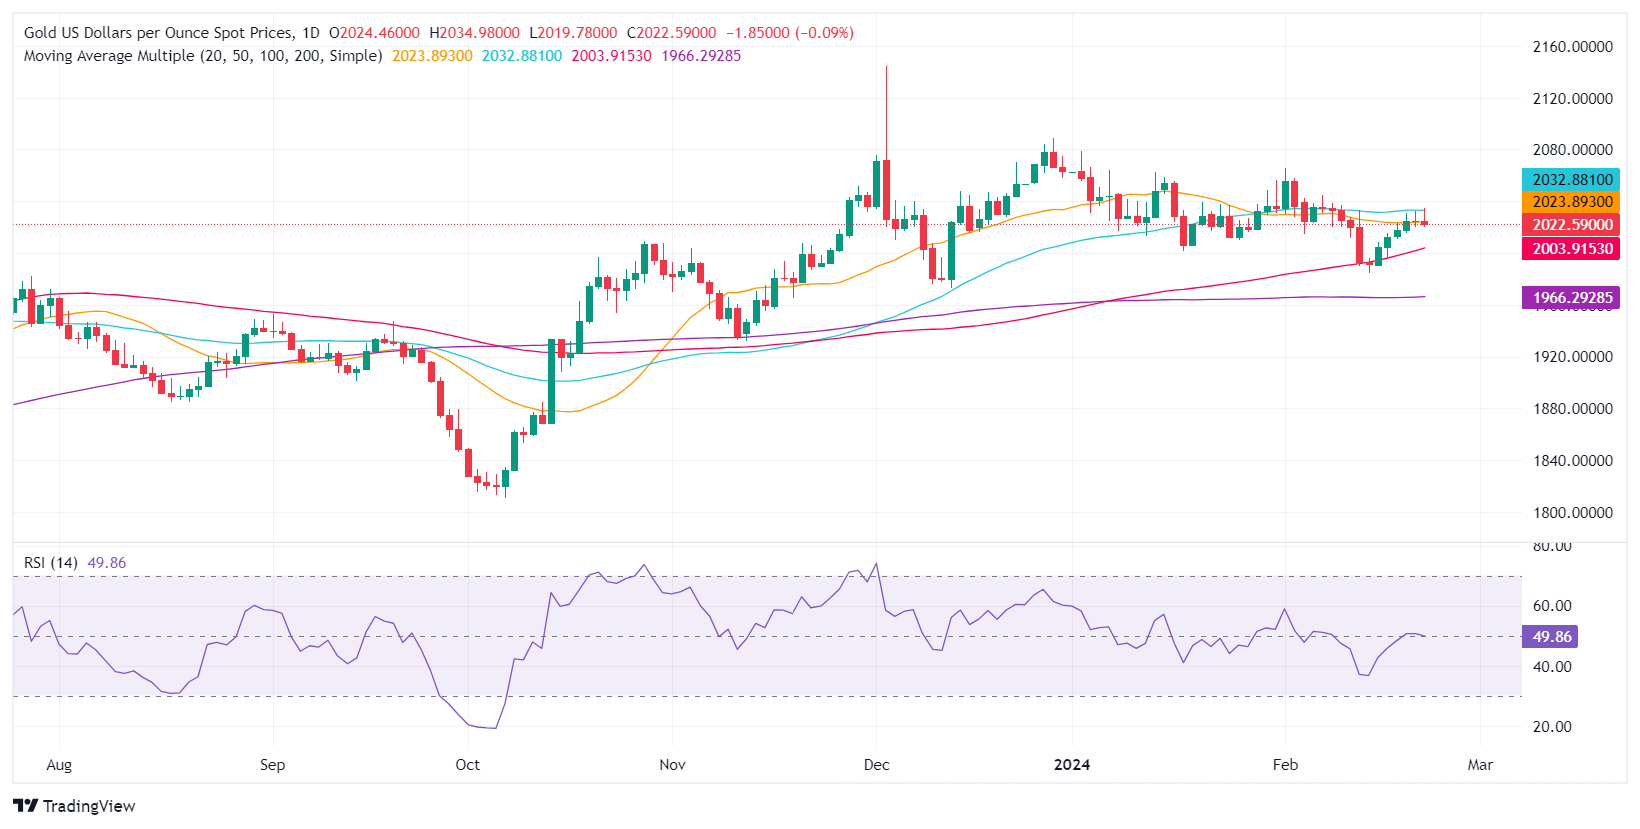
Gold is trading sideways but is slightly tilted to the downside, capped by the 50-day Simple Moving Average (SMA) at $2,033.27. The non-yielding metal's failure to breach the 50-day SMA opened the door for a pullback, which could be extended toward the October 27 daily high-turned-support at $2,009.42.A breach of the latter will expose the 100-day SMA at $2,002.05. The next stop would be the December 13 low at $1,973.13, followed by the 200-day SMA at $1,965.86.
On the flip side, if buyers lift the XAU/USD above the 50-day SMA, look for a challenge of the $2,050.00 figure. Upside risks lie at $2,065.60, the February 1 high.
More By This Author:
EUR/GBP Rises To Near 0.8570 After Retracing Recent Losses, Awaits PMI From UK, Eurozone
GBP/USD Trades With Modest Gains Below The Mid-1.2600s Ahead Of UK, US PMI Data
EUR/USD Holds Steady As US Dollar Recoups, German Growth Forecast Dims


Comments
Log in or sign up to join the conversation.