
Gold Price Analysis: Choppy Near $4,050 Ahead Of Key Releases
- Gold price analysis suggests a consolidation near $4,050 amid dollar strength and geopolitics.
- Markets await delayed US data releases as the Fed remains uncertain on rate cut policy.
- Technically, the price stays within trendlines, awaiting a catalyst for a breakout.
Gold price extended its downside on Monday, marking a pullback over the past three sessions as market participants reassessed shifting Fed expectations and a stronger dollar. The precious metal is hovering under $4,050 at the time of writing, as the Dollar Index remains close to 6-month highs. A firmer dollar remains a dominant headwind, making bullion expensive for international buyers.
Gold experienced sharp intraday swings last week as markets reacted to the Fed’s commentaries. As New York Fed President John Williams described the current policy as “restrictive”, which is interpreted as a sign that rate cuts remain on the table. The CME FedWatch tool indicates a 25-bps rate cut probability of 71%, down from 31% last week. However, hawkish tone from some Fed officials tempered enthusiasm, putting upcoming data in the limelight.
The divergence created a push-pull effect in gold, with rallies capped by $4,100 level. The upcoming batch of delayed US data, including PPI, Core PCE, Retail Sales, and Durable Goods Orders, now carries additional weight. Inflation data remains pivotal as any signs of softness could reignite the rate cut speculation, reviving the bullish momentum in gold.
Geopolitical developments, on the other hand, provide mild support to gold as the Russia-Ukraine conflict escalated after drone strikes on a power facility inside Russia. At the same time, Moscow claimed advances in the eastern region. Meanwhile, renewed US-Ukraine talks regarding a revised peace framework added more to the uncertainty. However, the Asian session on Monday diluted the impact, contributing to gold’s weakness.
Gold Key Events Ahead
- US PPI (Producer Price Index)
- US Retail Sales
- US Consumer Confidence
- Core PCE Price Index
Gold Technical Price Analysis: Consolidating Around Key MAs
(Click on image to enlarge)
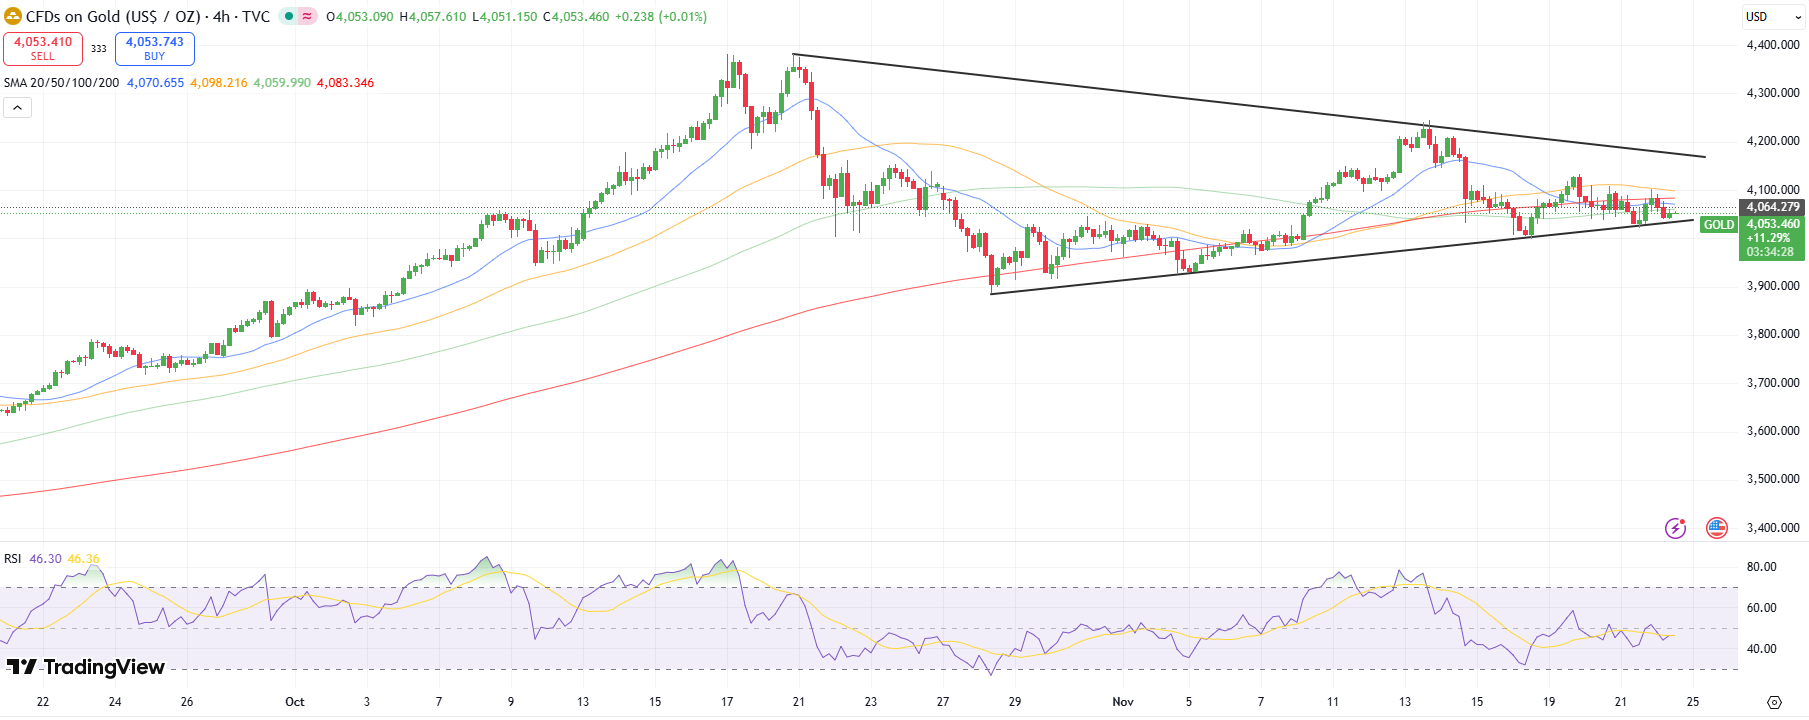
Gold 4-hour chart
The 4-hour chart for gold shows a consolidating phase near $4,050 as the key MAs form a cluster while the RSI hovers near the 50.0 level. The downside remains protected by a rising trendline, but it appears to be weak support.
In the event of a bearish breakout, the price could test the significant support level at $4,000, followed by a swing low near $3,880. On the upside, considerable resistance lies at $4,100, followed by a zone marked by a swing high and a falling trendline near $4,140-80.
More By This Author:
EUR/USD Weekly Forecast: Mixed Data Leaves Market DirectionlessUSD/JPY Outlook: BoJ Signals Lift Yen Despite Downbeat Data
GBP/USD Forecast: Weak UK Retail Sales Reinforce BoE Dovish Shift
Disclaimer: Foreign exchange (Forex) trading carries a high level of risk and may not be suitable for all investors. The risk grows as the leverage is higher. Investment objectives, risk ...
more

