
Gold Miners: The Underperformance Screams “Bearish!”
While gold moved slightly above its recent highs yesterday, the gold stocks moved to their previous lows. Can you hear the bears approaching?
Gold made another reversal yesterday, and the miners declined profoundly – also once again. Just as in early 2013 – that’s extremely bearish.
Gold futures moved to new intraday highs yesterday, but they ended the session $1.90 lower, creating yet another shooting star reversal candlestick. Seeing just one reversal is bearish on its own, but seeing more than one in a row is profoundly bearish.
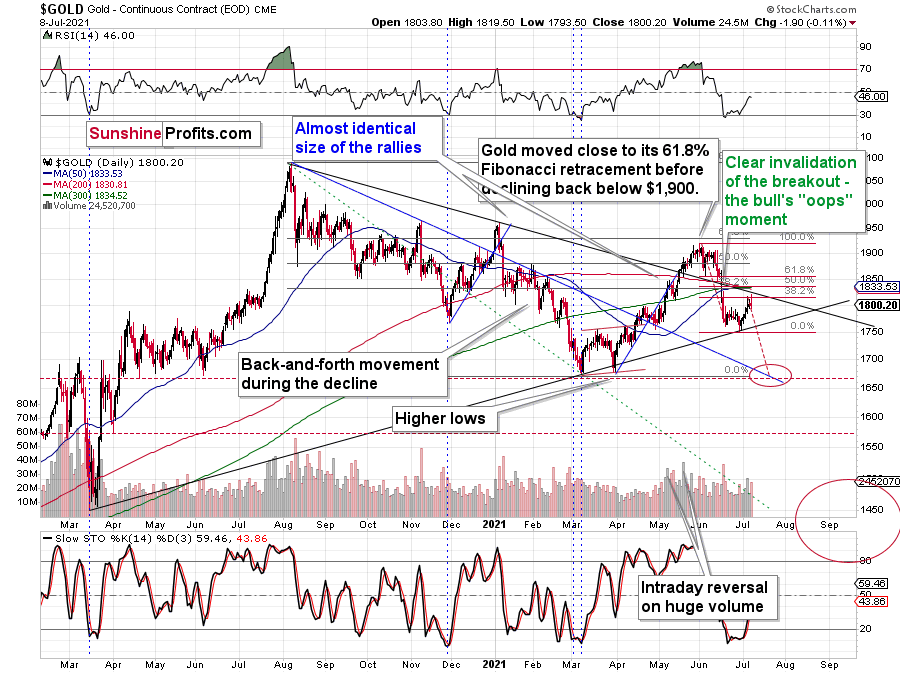
Please note that gold reversed after moving slightly above the 38.2% Fibonacci retracement based on the recent decline. The minimum one of the likely correction sizes was reached, so the decline can now continue. The RSI is no longer oversold, but rather close to the middle of its trading range. This tells us that bearish gold forecasts are clearly justified. Also based on the reversals that we just saw, this move is likely to be to the downside.
The Gold Miners
Another detail that serves as a bearish confirmation is the performance of the mining stocks.
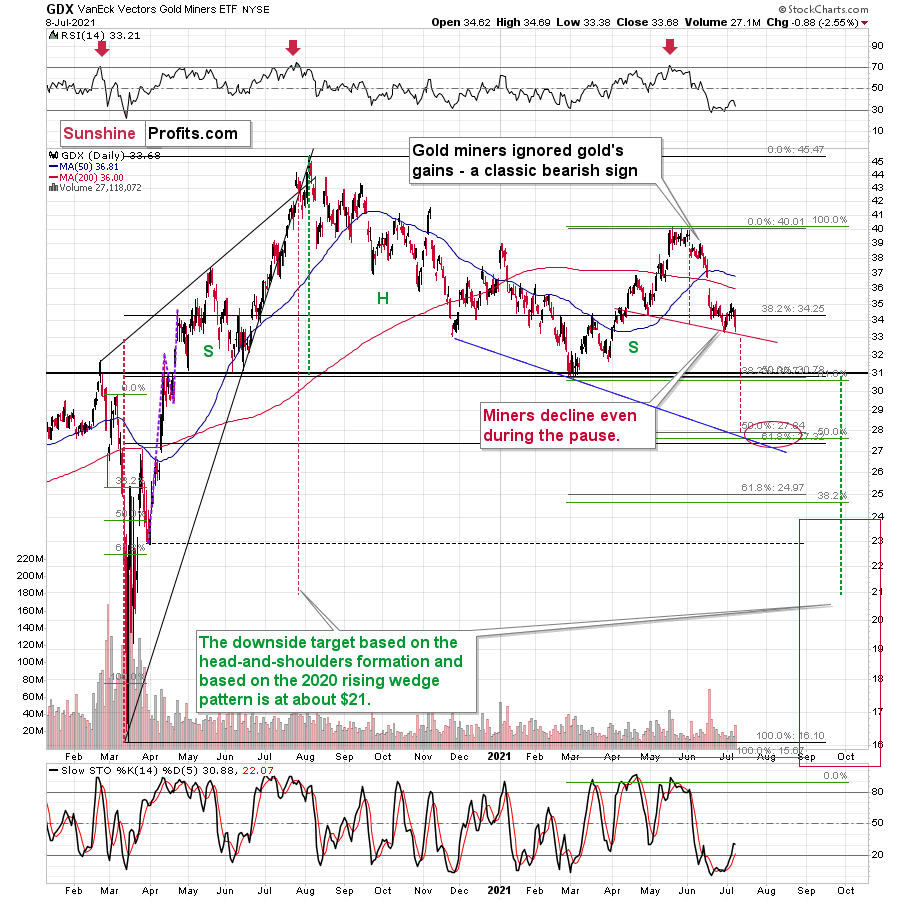
While gold moved slightly above its recent highs during yesterday’s session, the gold stocks moved to their previous lows. If this is not shocking proof of extreme underperformance, then I don’t know what would be one.
The mining stocks simply can’t wait to break to new lows. In fact, the junior miners – my proxy of choice for the current (profitable) short trade – already broke to new lows.
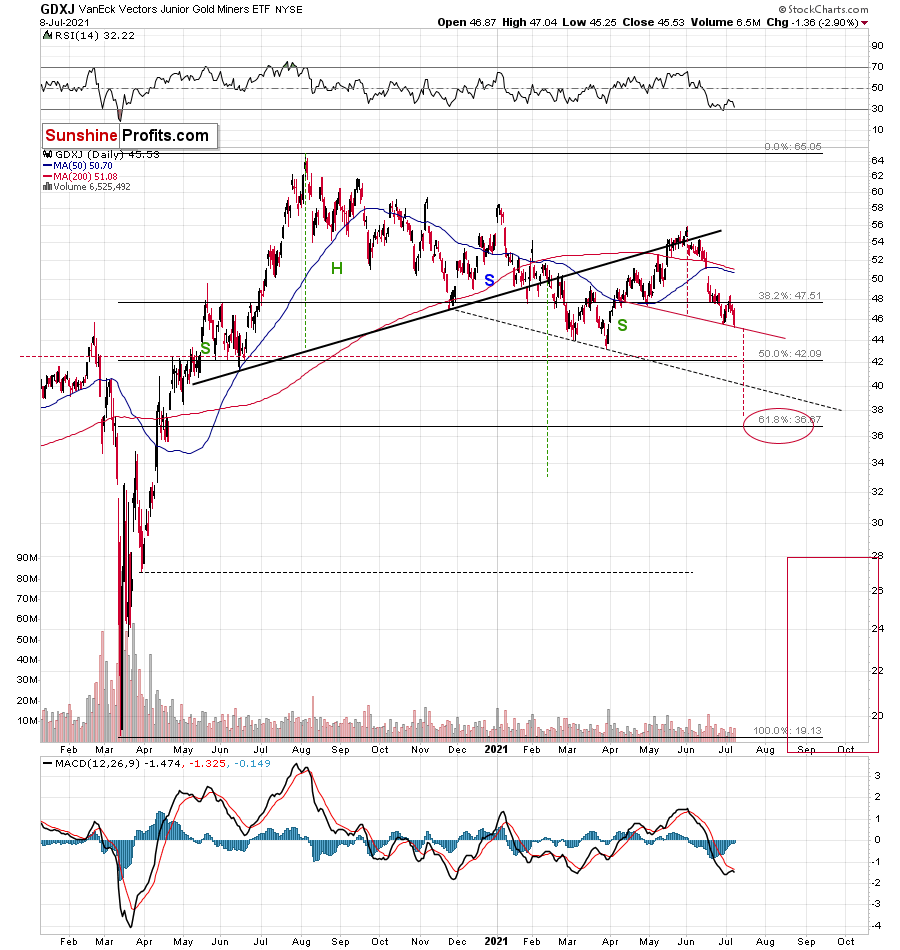
On June 29 (the June low), the GDXJ ETF closed at $45.83, and yesterday it closed at $45.53. Ladies and gentlemen, we have a breakdown.
Of course, it was not confirmed yet, but the fact that we saw a new low while gold made a new short-term intraday high is extremely bearish.
The interesting detail about both (GDX and GDXJ) ETFs is that the recent price moves created bearish head-and-shoulders formations in them. The targets based on such formations are based on the size of their heads. I marked the height of the head and the targets with red, dashed lines.
It seems that we might see a move below $38 in the GDXJ before it corrects in a more meaningful way.
Ok, but shouldn’t March lows provide strong support and trigger a rebound?
Yes, the previous lows provide relatively important support, but:
- Miners have been very weak relative to gold recently, and they don’t even need to keep it up in order to slide below the March lows – they could behave “normally” for this to happen.
- Gold seems to be ready to slide significantly – to its March lows or so. In order to do it, it would need to approximately repeat its June slide.
If gold repeats its June slide, it will decline by about $150.
Taking the entire decline into account (since August 2020), for every $1 that gold fell, on average, the GDX was down by about 4 cents (3.945 cents) and GDXJ was down by about 6.5 cents (6.504 cents).
This means that if gold was to fall by about $150 and miners declined just as they did so far in the past year (no special out- or underperformance), they would be likely to fall by $5.92 (GDX) and $9.76 (GDXJ). Given yesterday’s closing prices, this would imply price moves to $27.76 (GDX) and $35.78 (GDXJ).
Interestingly, both above-mentioned price levels are in perfect tune with the target areas that I placed on the charts based on the head and shoulders patterns and the 61.8% Fibonacci retracement level (which is based on the entire 2020 rally). This adds to their credibility. Naturally, I will be making updates as the situation develops and we get more information.
Disclaimer: All essays, research and information found on the Website represent the analyses and opinions of Mr. Radomski and Sunshine Profits' associates only. As such, it may prove wrong ...
more

