
Autumn is just around the corner, and while the precious metals tasted some success most recently, the medium-term is still set for a downtrend.
With Fed Chairman Jerome Powell sticking to his dovish guns and U.S. nonfarm payrolls elongating the central bank’s perceived taper timeline, gold, silver, and mining stocks were extremely happy campers. However, with event-driven rallies much more semblance than substance, I warned on Sep. 7 that the rollercoaster of emotions would likely end in tears.
I wrote:
With the 2013 analogue leading the gold miners down an ominous path, the HUI Index and the GDX ETF have rallied by roughly 8% off their recent lows. However, identical developments occurred in 2013, and neither bout of optimism invalided their bearish medium-term outlooks.
And after the GDX ETF and the GDXJ ETF (our profitable short position) plunged by 5.35% and 6.98% respectively last week, summertime sadness confronted the precious metals. Likewise, with more melancholy moves likely to materialize over the medium term, gold, silver, and mining stocks should hit lower lows during the autumn months.
To explain, the HUI Index also plunged by nearly 6% last week, and the reversal of the previous corrective upswing mirrors its behavior from 2013. In addition, with its stochastic oscillator and its RSI (Relative Strength Index) also a spitting image, an ominous re-enactment of 2013 implies significantly lower prices over the medium term.
Please see below:
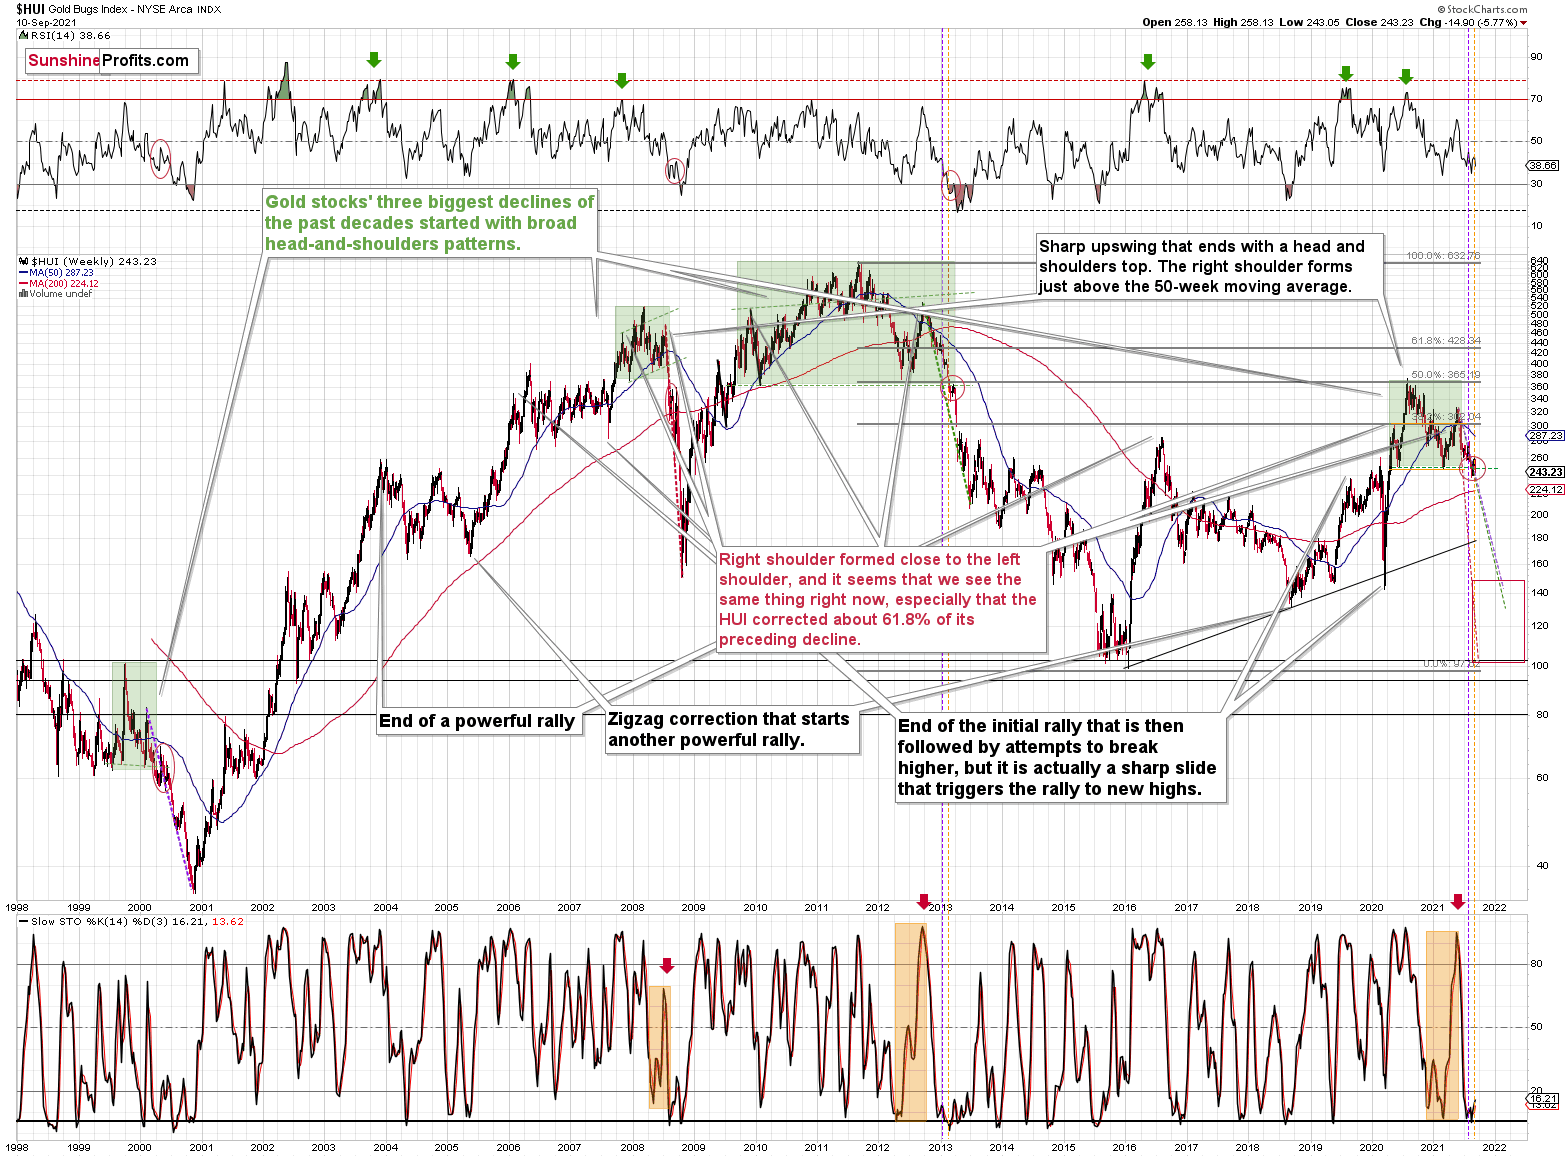
What’s more, the vertical, dashed lines above demonstrate how the HUI Index is following its 2012-2013 playbook. For example, after a slight buy signal from the stochastic indicator in 2012, the short-term pause was followed by another sharp drawdown. For context, after the HUI Index recorded a short-term buy signal in late 2012 – when the index’s stochastic indicator was already below the 20 level (around 10) and the index was in the process of forming the right shoulder of a huge, medium-term head-and-shoulders pattern – the index moved slightly higher, consolidated, and then fell off a cliff. Thus, the HUI Index is quite likely to decline to its 200-week moving average (or so) before pausing and recording a corrective upswing. That’s close to the 220 level. Thereafter, the index will likely continue its bearish journey and record a final medium-term low sometime in December.
Furthermore, I warned previously that the miners’ drastic underperformance of gold was an extremely bearish sign. There were several weeks when gold rallied visibly and the HUI Index actually declined modestly. And now, gold stocks are trading close to their previous 2021 lows, while gold is almost right in the middle between its yearly high and its yearly low.
And why is this so important? Well, because the bearish implications of gold stocks’ extreme underperformance still remain intact.
Let’s keep in mind that the drastic underperformance of the HUI Index also preceded the bloodbath in 2008 as well as in 2012 and 2013. To explain, right before the huge slide in late September and early October 2008, gold was still moving to new intraday highs; the HUI Index was ignoring that, and then it declined despite gold’s rally. However, it was also the case that the general stock market suffered materially. If stocks didn’t decline so profoundly back then, gold stocks’ underperformance relative to gold would have likely been present but more moderate.
Nonetheless, broad head & shoulders patterns have often been precursors to monumental collapses. For example, when the HUI Index retraced a bit more than 61.8% of its downswing in 2008 and in between 50% and 61.8% of its downswing in 2012 before eventually rolling over, in both (2008 and 2012) cases, the final top – the right shoulder – formed close to the price where the left shoulder topped. And in early 2020, the left shoulder topped at 303.02. Thus, three of the biggest declines in the gold mining stocks (I’m using the HUI Index as a proxy here) all started with broad, multi-month head-and-shoulders patterns. And in all three cases, the size of the declines exceeded the size of the head of the pattern. As a reminder, the HUI Index recently completed the same formation.
Yes, the HUI Index moved back below the previous lows and the neck level of the formation, which – at face value – means that the formation was invalidated, but we saw a similar “invalidation” in 2000 and in 2013. And then, the decline followed anyway. Consequently, I don’t think that taking the recent move higher at its face value is appropriate. It seems to me that the analogies to very similar situation from the past are more important.
As a result, we’re confronted with two bearish scenarios:
- If things develop as they did in 2000 and 2012-2013, gold stocks are likely to bottom close to their early-2020 low.
- If things develop like in 2008 (which might be the case, given the extremely high participation of the investment public in the stock market and other markets), gold stocks could re-test (or break slightly below) their 2016 low.
In both cases, the forecast for silver, gold, and mining stocks is extremely bearish for the next several months.
For even more confirmation, let’s compare the behavior of the GDX ETF and the GDXJ ETF. Regarding the former, investors rejected the senior miners (GDX) attempt to recapture their 50-day moving average and the failure was perfectly in tune with what I wrote on Sep. 7:
Large spikes in the daily volume are often bearish, not bullish. To explain, three of the last four-volume outliers preceded an immediate top (or near) for the GDX ETF, while the one that preceded the late July rally was soon followed by the GDX ETF’s 2020 peak. Thus, when investors go ‘all in,’ material declines often follow. And with that, spike-high volume during the GDX ETF’s upswings often presents us with great shorting opportunities.
Please see below:
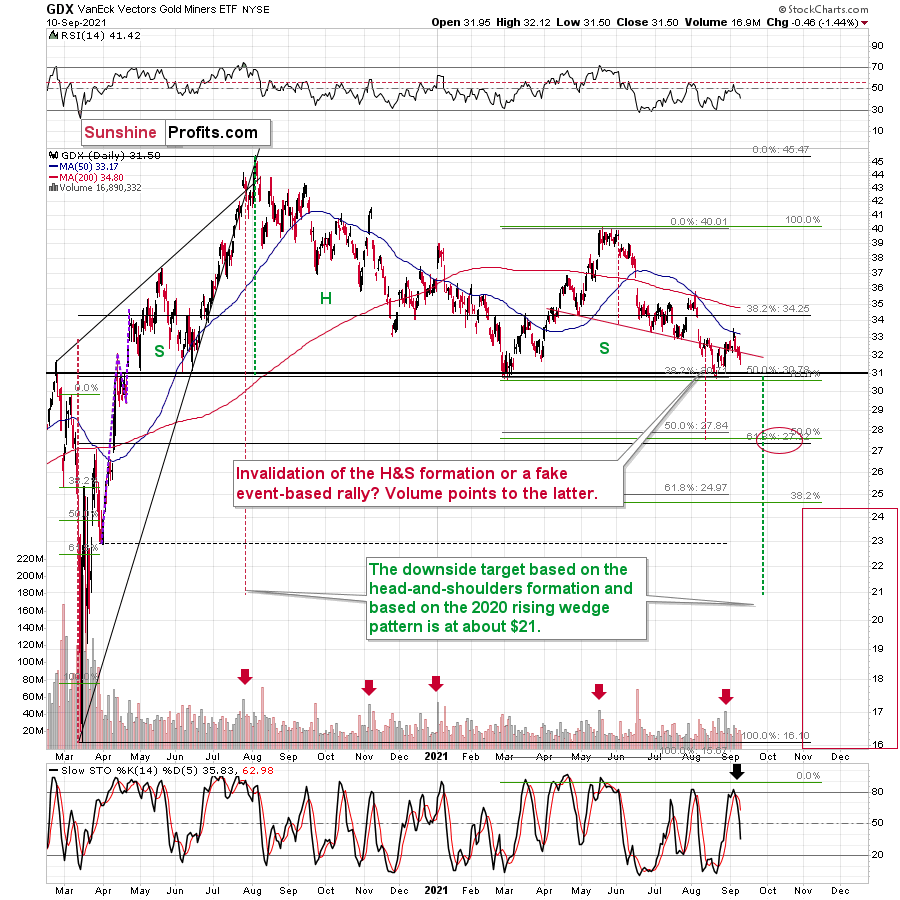
Even more bearish, not only did last week’s plunge usher the GDX ETF back below the neckline of its bearish head & shoulders pattern (the horizontal red line on the right side of the chart above), but the sell signal from the stochastic oscillator remains firmly intact. As a result, ominous clouds continue to form.
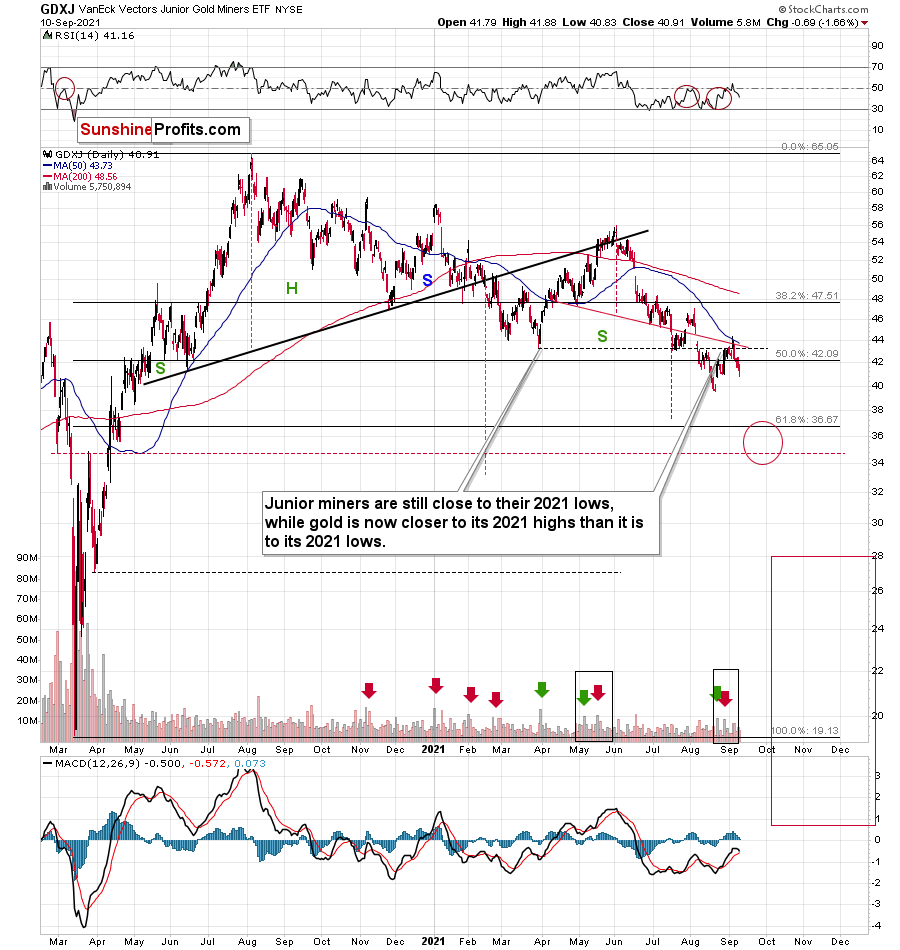
And with the GDXJ ETF stuck in a similar rut, I wrote on Sep. 7 that overzealous investors would likely end the week disappointed:
With the current move quite similar to the corrective upswing recorded in mid-May, the springtime bounce was also followed by a sharp drawdown. As a result, the GDXJ ETF could be near its precipice, as its 50-day moving average is right ahead. And with the key level now acting as resistance, investors’ rejection on Sep. 3 could indicate that the top is already here.
Moreover, while the junior miners followed the roadmap to perfection, the GDXJ ETF still remains ripe for lower lows over the medium term.
Please see below:
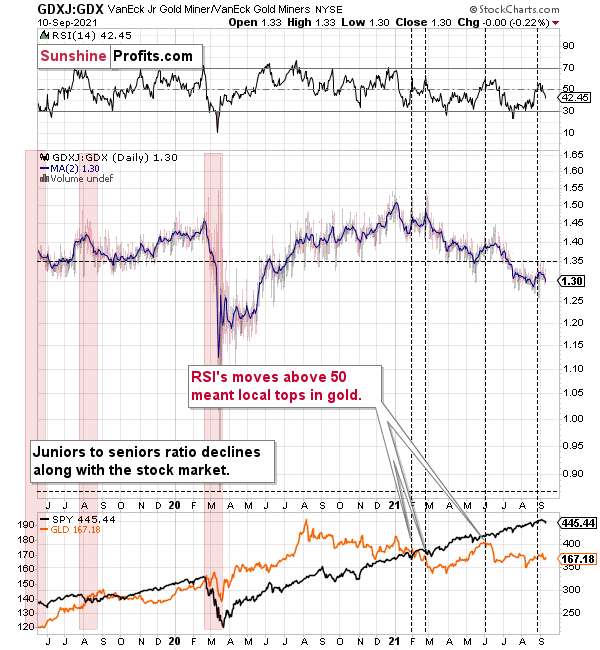
Finally, while I’ve been warning for months that the GDXJ/GDX ratio was destined for devaluation, after another sharp move lower last week, the downtrend remains intact. For example, when the ratio’s RSI jumped above 50 three times in 2021, it coincided with short-term peaks in gold. Second, the trend in the ratio this year has been clearly down, and there’s no sign of a reversal, especially when you consider that the ratio broke below its 2019 support (which served as resistance in mid-2020). When the same thing happened in 2020, the ratio then spiked even below 1.
More importantly, though, with the relative weakness likely to persist, the profits from our short position in the GDXJ ETF should accelerate during the autumn months.
The bottom line?
If the ratio is likely to continue its decline, then on a short-term basis we can expect it to decline to 1.27 or so. If the general stock market plunges, the ratio could move even lower, but let’s assume that stocks decline moderately (just as they did in the last couple of days) or that they do nothing or rally slightly. They’ve done all the above recently, so it’s natural to expect that this will be the case. Consequently, the trend in the GDXJ to GDX ratio would also be likely to continue, and thus expecting a move to about 1.26 - 1.27 seems rational.
If the GDX is about to decline to approximately $28 before correcting, then we might expect the GDXJ to decline to about $28 x 1.27 = $35.56 or $28 x 1.26 = $35.28. In other words, $28 in the GDX is likely to correspond to about $35 in the GDXJ.
Is there any technical support around $35 that would be likely to stop the decline? Yes. It’s provided by the late-Feb. 2020 low ($34.70) and the late-March high ($34.84). There’s also the late-April low at $35.63. Conservatively, I’m going to place the profit-take level just above the latter.
Consequently, it seems that expecting the GDXJ to decline to about $35 is justified from the technical point of view as well.
In conclusion, gold, silver, and mining stocks went from delighted to despondent, as the technical downpour continues to rain on their parade. And while a major buying opportunity may present itself in December, the next few months will likely elicit more tears than cheers. As a result, while we eagerly await the opportunity to go long the precious metals and participate in their secular uptrends, bearish breakdowns, stock market struggles, and the Fed’s taper timeline will likely dampen their moods over the medium term.

Comments
Log in or sign up to join the conversation.