
Gold, Miners: How Long Will Short-Term Rally Last?
Gold rallied, gold miners soared to new March highs and the USD Index finally moved lower, and most likely, these price moves are not yet over.
The precious metals market finally moved yesterday (Mar. 9) after providing us with bullish indications for quite a few days. Let’s jump right into charts and examine the details, starting with the part of the precious metals market that showed particular strength – mining stocks.
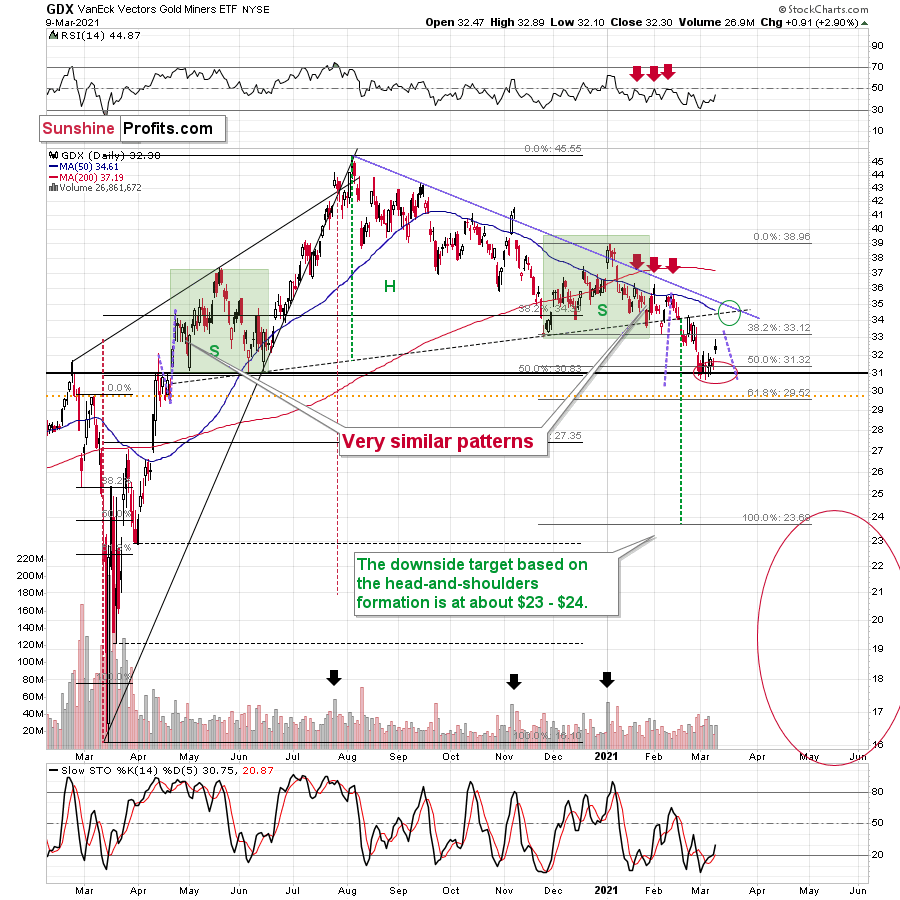
Figure 1 - VanEck Vectors Gold Miners ETF (GDX)
Even though gold moved lower in early March, gold miners stopped declining after reaching my target area based on several techniques – most importantly the 50% Fibonacci retracement based on the entire 2020 rally, and the previous lows and highs. Just as miners’ relative weakness had previously heralded declines for the entire precious metals sector, their strength meant that a rally was about to start. And that’s just what we saw yesterday (Mar. 9).
Ultimately, it seems that the above corrections will result in the GDX ETF moving to about $34 or so.
The resistance levels in the $34 - $35 area are provided by:
- The late-February 2020 high
- The rising neck level of the previously completed head and shoulders pattern
- The analogy to how big miners’ correction was in April (assuming that the mirror similarity continues)
- The declining blue resistance line
- The 50-day moving average
Additionally, please note that the last few local tops were accompanied by RSI at about 50. The latter is currently below 45, suggesting that this rally has more potential, but that it’s not particularly extreme.
The confirmation that the top is indeed in might come from the volume. Please note that the last three times when we saw really important tops, the GDX rallied on particularly strong volume. If we see something like that within the next 5 trading days or so (quite likely on Monday or close to it), we’ll have an even bigger chance of catching the reversal.
Consequently, the GDX is likely to form a top in the above-described area.
After breaking below the head-and-shoulders pattern, gold miners would then be likely to verify this breakdown by moving back up to the neck level of the pattern. Then, we would likely see another powerful slide – perhaps to at least $24.
This is especially the case since silver and mining stocks tend to decline particularly strongly if the stock market is declining as well. And while the exact timing of the market’s slide is not 100% clear, the day of reckoning for stocks is coming, and it might be very, very close.
As I explained previously, based on the similarities to the 1929 and 2008 declines, it could be the case that the precious metals sector declines for about three months after the general stock market tops. And it seems that we won’t have to wait long for the latter. In fact, the next big move lower in stocks might already be underway, as the mid-Feb. 2021 top could have been the final medium-term top.
Let’s consider what the GDX and GLD did on an intraday basis yesterday.
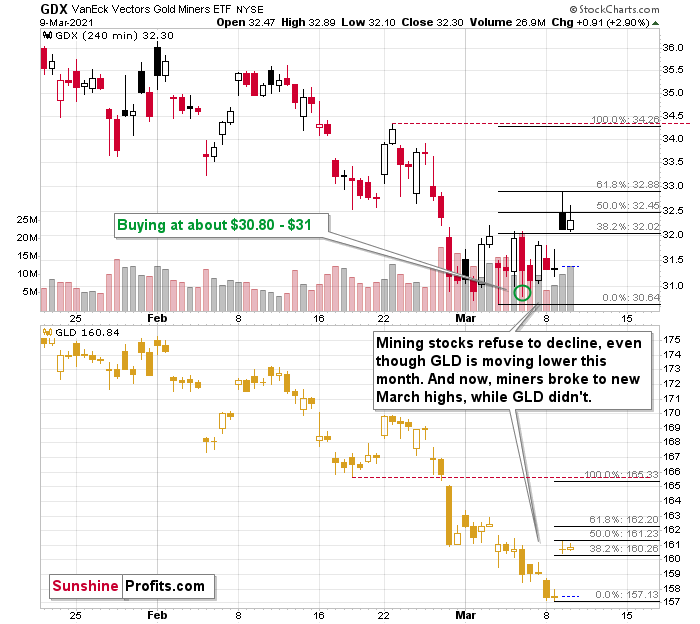
Figure 2 - VanEck Vectors Gold Miners ETF (GDX) and Gold ETF (GLD) Comparison
As I already wrote, mining stocks rallied to new monthly highs, and the above 4-hour chart (each candlestick represents 4 hours of trading) makes it crystal-clear that the late-February bottom was the moment after which miners stopped declining and started to trade sideways. Gold (here: the GLD ETF, which I’m using to have an apples-to-apples comparison – both ETFs trade on the same exchange) continued to decline in March. Well, to be precise, miners did form new yearly lows in March, and we went long almost right at one of those intraday lows, but the moves were not significant enough to really change anything.
So, since miners no longer wanted to decline, and there were only two other things left for them to do: either nothing or rally.
They had been doing nothing for several days, due to the lack of bullish leadership in gold. They just got this leadership yesterday, and they soared.
Now, let’s keep in mind what I wrote in yesterday’s intraday Alert – namely, that mining stocks tend to rally particularly well in the initial part of the upswing, and then they underperform during the final part of the rally. So, when gold is above $1,750 or so, miners might already be rallying to a limited degree. Consequently, miners might rally above $34.27, but that is far from being certain. They might actually rally slightly less – perhaps to exactly $34 or so.
I applied the Fibonacci retracement levels to the above chart, but I actually used them as Fibonacci extensions. My current upside target for gold is at about $1,770 (which corresponds to about $166 in the GLD ETF) and it’s at about $34 for mining stocks (GDX ETF). The Fibonacci extensions emphasize that if both targets were to be reached, then it means that gold so far rallied (intraday) about half of its entire rally, while mining stocks rallied (intraday) about 61.8% of their entire rally. This perfectly fits miners’ tendency to outperform in the initial part of a given move, which makes both price targets more reliable.
Having said that, let’s move to gold.
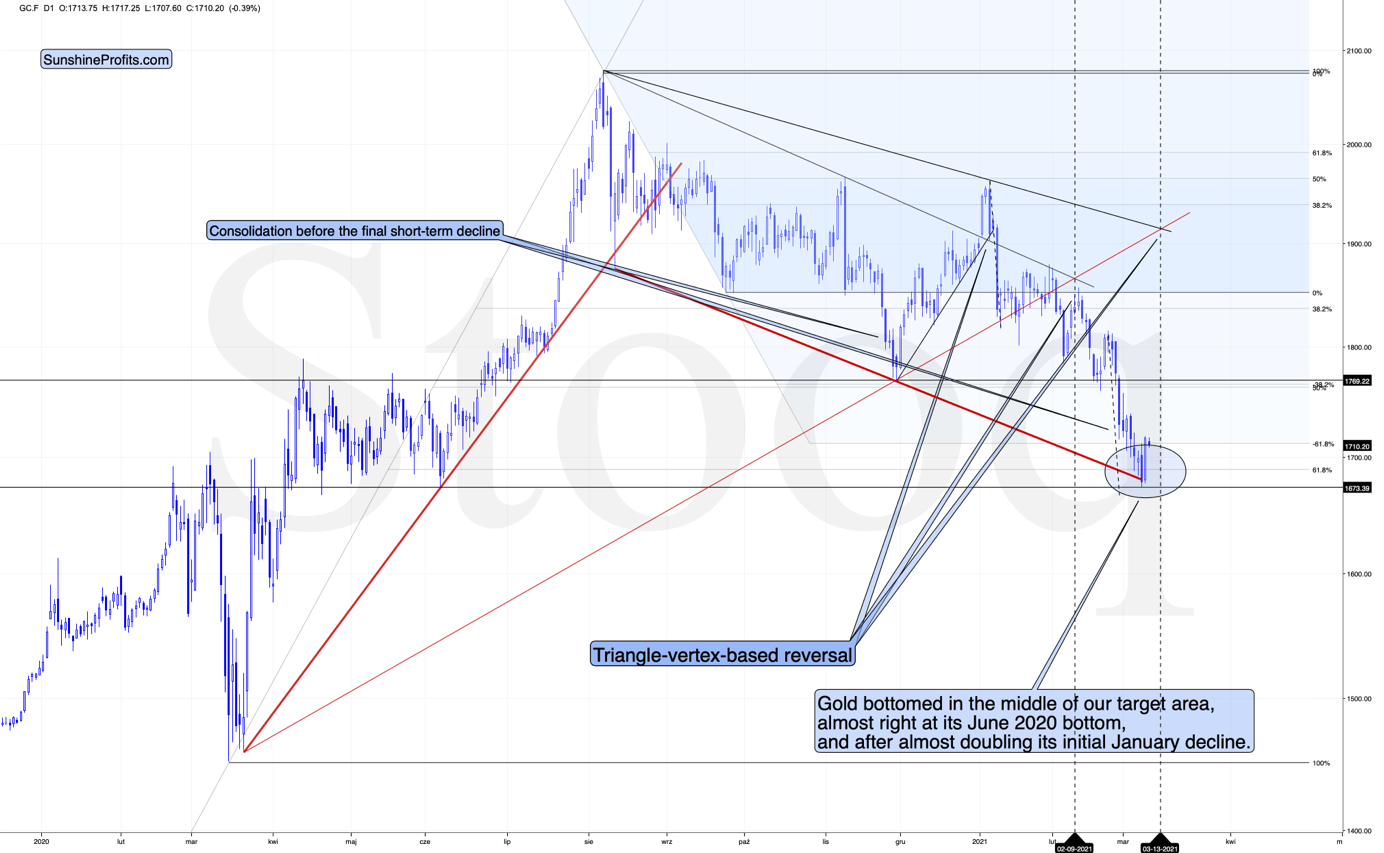
Figure 3 - COMEX Gold Futures
Gold rallied strongly after bottoming right in the middle of my target area and after moving almost right to its June 2020 bottom, and after almost doubling its initial January decline. Yesterday’s rally also meant invalidation of the brief breakdown below the 61.8% Fibonacci retracement level based on the entire 2020 rally. Thus, the very short-term trend is up.
Please keep in mind that the upswing might be relatively short-lived – perhaps lasting only one week or so. There’s a triangle-vertex-based reversal point on Monday, so it wouldn’t be surprising to see an interim top at that time, especially considering that:
- The triangle-vertex-based turning points have been working particularly well in the recent past – they marked the January and February tops.
- The corrective upswings during this medium-term decline (especially in mining stocks) often took about a week to complete – at least the easy part of the upswing took a week.
The USD Index has been rallying relentlessly – just like in 2018 – in the last couple of days, but a quick pullback would not be surprising. In fact, it seems that one is already underway.
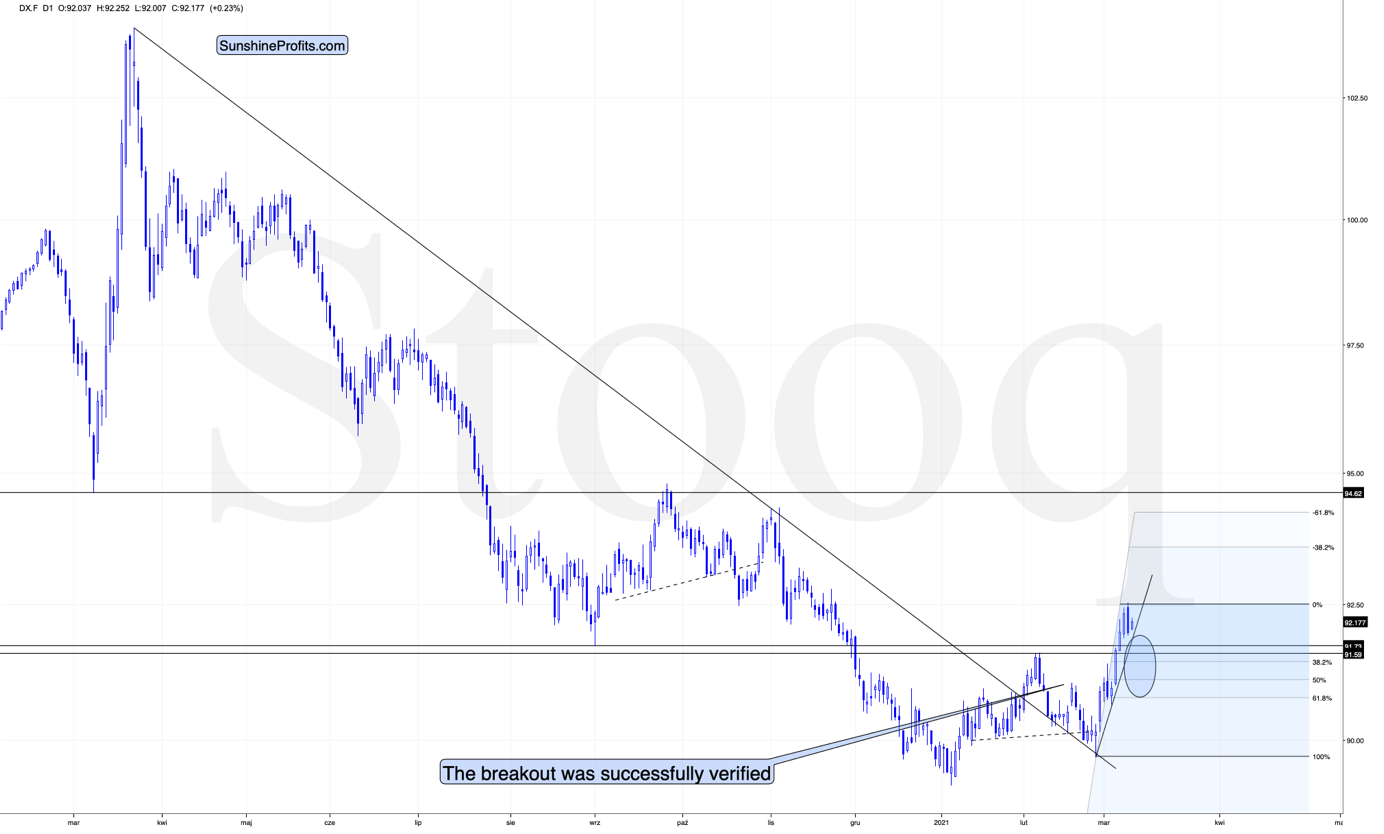
Figure 4 - USD Index (DX.F)
On March 8, the USD Index had closed above its lowest daily closing price of August 2020 (92.13), but yesterday, it closed back below this resistance. This means that we just saw an invalidation of the breakout – which is a bearish sign for the short term.
How low could the USD Index move during this pullback? Not particularly low, as the similarity to 2018 implies a rather unbroken rally. The February 2021 high of 91.6 seems to be a quite likely target, but we might see the USDX move a bit lower as well – perhaps to one of the classic Fibonacci retracements based on the recent upswing – the lowest of them (the 61.8% one) being at about 90.8.
This pullback might trigger a question about the validity of the analogy to the 2018 rally, which seems to have taken place without any interruptions.
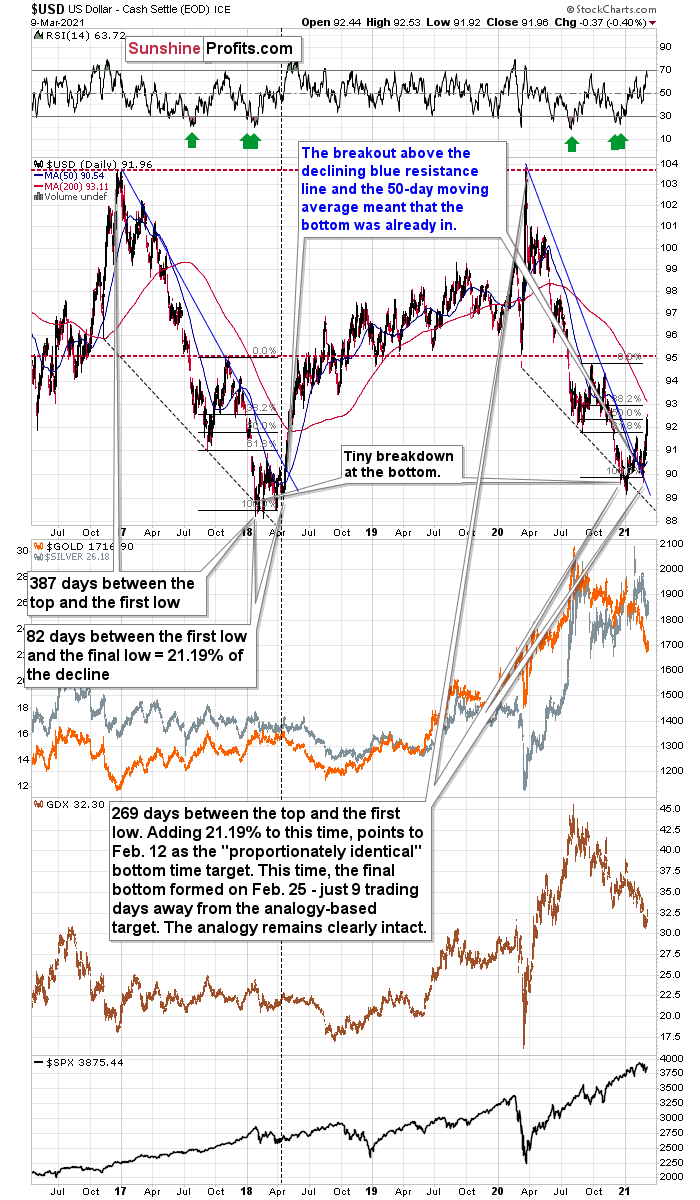
Figure 5
The analogy seems to remain intact when looking at it from the long-term point of view. Let’s keep in mind the recent decline was a bit sharper and it took less time to complete.
The 2017 – 2018 decline took 387 day (between the top and the first low) and then there were 82 days between the initial and the final low (21.19% of the decline).
This time, there were 269 days between the top and the first low. Adding 21.19% to this time, points to Feb. 12 as the "proportionately identical" bottom time target. The final bottom formed on Feb. 25 - just 9 trading days away from the analogy-based target. The analogy remains clearly intact.
“So, doesn’t it imply that there shouldn’t be any pullbacks until the USD Index rallies above 94?”
No. And this becomes obvious once we zoom in.
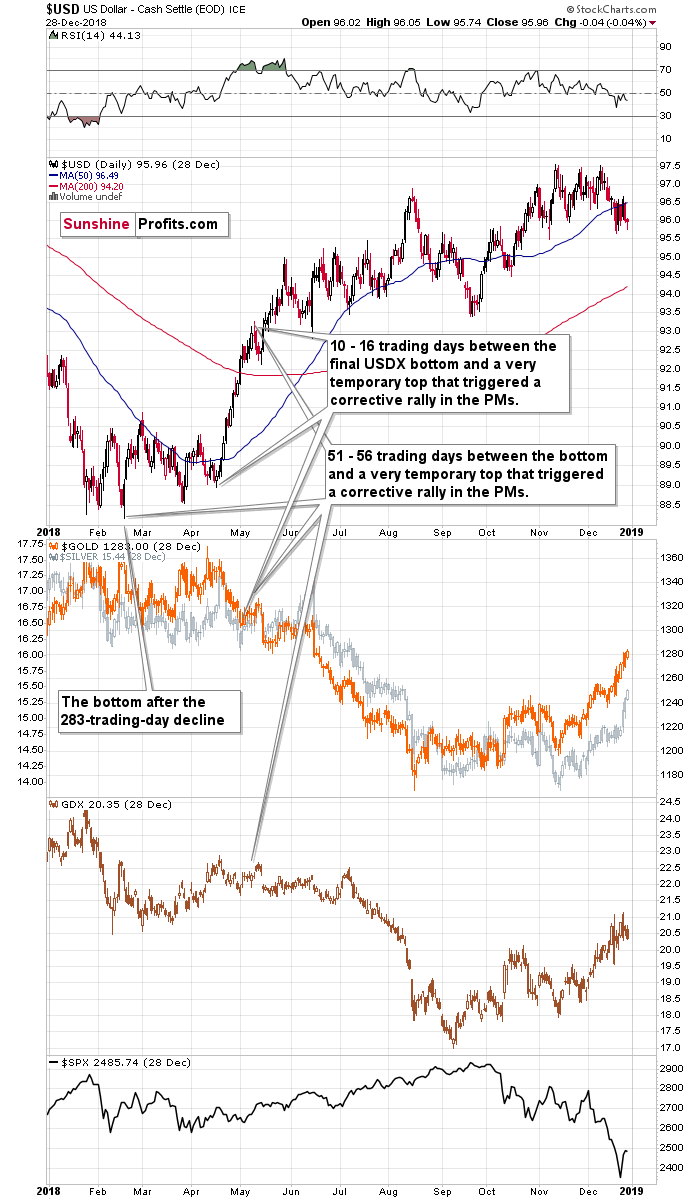
Figure 6
You see, it’s not true that there were no pullbacks during the 2018 rally. There were, but they were simply too small to be visible from the long-term point of view.
The first notable pullback took place in early May 2018, and it contributed to a corrective upswing in the precious metals market. To be precise, the USD Index declined after rallying for 56 trading days, but gold rallied earlier – 51 trading days after the USD Index’s final bottom. The USDX’s immediate-top formed 16 trading days after its final bottom, and gold’s bottom formed 10 trading days after the USD’s final bottom.
Comparing this to the size of the previous decline in terms of the trading days, it was:
- 51 – 56 trading days / 283 trading days = 18.02% - 19.79%
- 10 – 16 trading days / 283 trading days = 3.53% - 5.65%
Now, let’s examine the current situation.
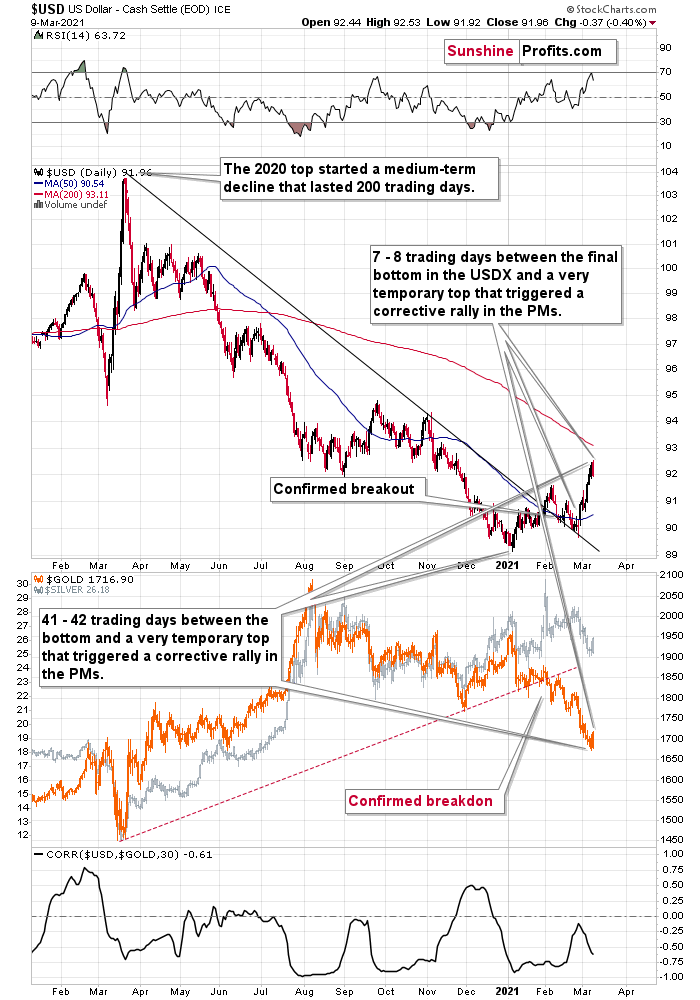
Figure 7
The preceding decline lasted for 200 trading days and there were 41 – 42 trading days between the final USDX bottom and the short-term reversals in gold and USDX. Comparing this to the final USDX bottom, we get 7 – 8 trading days.
Applying the previous percentages to the length of the most recent medium-term decline in the USD Index provides us with the following:
- 18.02% - 19.79% x 200 trading days = ~36 - ~40 trading days
- 3.53% - 5.65% x 200 trading days = ~7 - ~11 trading days
The above estimation of about 36 – 40 trading days almost perfectly fits the current 41 – 42-day delay, and the estimation of about 7 – 11 trading days almost perfectly fits the current delay of 7 – 8 trading days.
In other words, the analogy to the 2018 performance does not only remain intact – it actually perfectly confirms the validity of the current corrective upswing. Once again, it’s very likely just a pullback, not a big trend reversal.
Also, please note that back in 2018, the USD Index corrected after moving back above its mid-2017 lows and now we see the analogy to that – the USDX corrects after moving back above its mid-2020 lows. Back in 2017, the USD Index corrected to approximately its previous short-term high (the January 2018 high). Now, the February high is providing strong support at about 91.6 – that’s where this brief correction might end – on an approximate basis.
The above perfectly fits the scenario in which the precious metals market rallies on a very short-term basis (likely to about $1,770 in gold and about $34 in GDX), and then resumes its medium-term decline.
Disclaimer: All essays, research, and information found on the Website represent the analyses and opinions of Mr. Radomski and Sunshine Profits' associates only. As such, it may prove wrong ...
more


Thank you for providing exact and valuable service through your emails, Mr. Radomski. Spot on!
Thank you!
Long term (Greater than 2 years...weekly chart), we bottomed in 2016. Medium term (Greater than 1 year...daily chart) we bottomed in Mar 2020. Short term (Less than 6 months 4 hour chart), we have not bottomed. Since Jan we have hit up against a well defined downward channel (shown on Daily and Hourly charts...days 1/29, 2/10, and 2/24), and have failed. Today that top part of channel sits at around 1800. The bottom part of the channel has been violated to the downside. Until we clear the upper line of this corrective channel we cannot say we have a short term bottom. The real question is what is the short term bottom price target and when will we get there. Options expiration next week has been a bloodbath this year for Gold. Short squeezes on highly shorted stocks seems to have also quietly picked up again (GameStop at 265). Options week will be interesting. Will Gold shorts panic and attempt to push the market down to get out of their highly leveraged short positions? I would not be long next week. As to a (short term) bottom.. I vote 61% retracement (measured from the 2018 lows to Jan 2021 High) around 1536. I think a major chunk of this will come next week. Then up from there
Interesting point, thanks. I think we define short-term moves as something different. To me, a short-term move would be a weekly rally, for example - and I think we're more or less in the middle of one.
I think we bottomed.
I think so too, but then again, I view this move as a counter-trend rally that would be likely followed by another move lower perhaps as early as next week.