
Gold rallied by almost $10 yesterday, while the stock market reversed and ended the session in the green. Why did miners decline anyway?
Because they’re weak, that’s why. This is because there is a medium-term downtrend in them. In fact, let’s keep in mind that it was only gold that managed to break above the 2011 highs – neither silver nor mining stocks got even close to similar price levels. Thus, has the real bull market in the precious metals sector begun yet? No, it hasn’t. It was only gold that caught people’s attention, and only temporarily so.
The fact is that despite the open-ended QE, historically low-interest rates for years, and a global pandemic that triggered worldwide lockdowns, gold was unable to hold the breakout above its 2011 high. If this doesn’t make you suspicious about the real strength of the gold bull market, then I don’t know what would.
Let’s check the HUI Index – the flagship proxy for gold stocks – and see where the gold miners are.
After all, gold stocks tend to perform exceptionally well at the beginning of massive bull markets. For example, that was the case between 2000 and 2002.
(Click on image to enlarge)
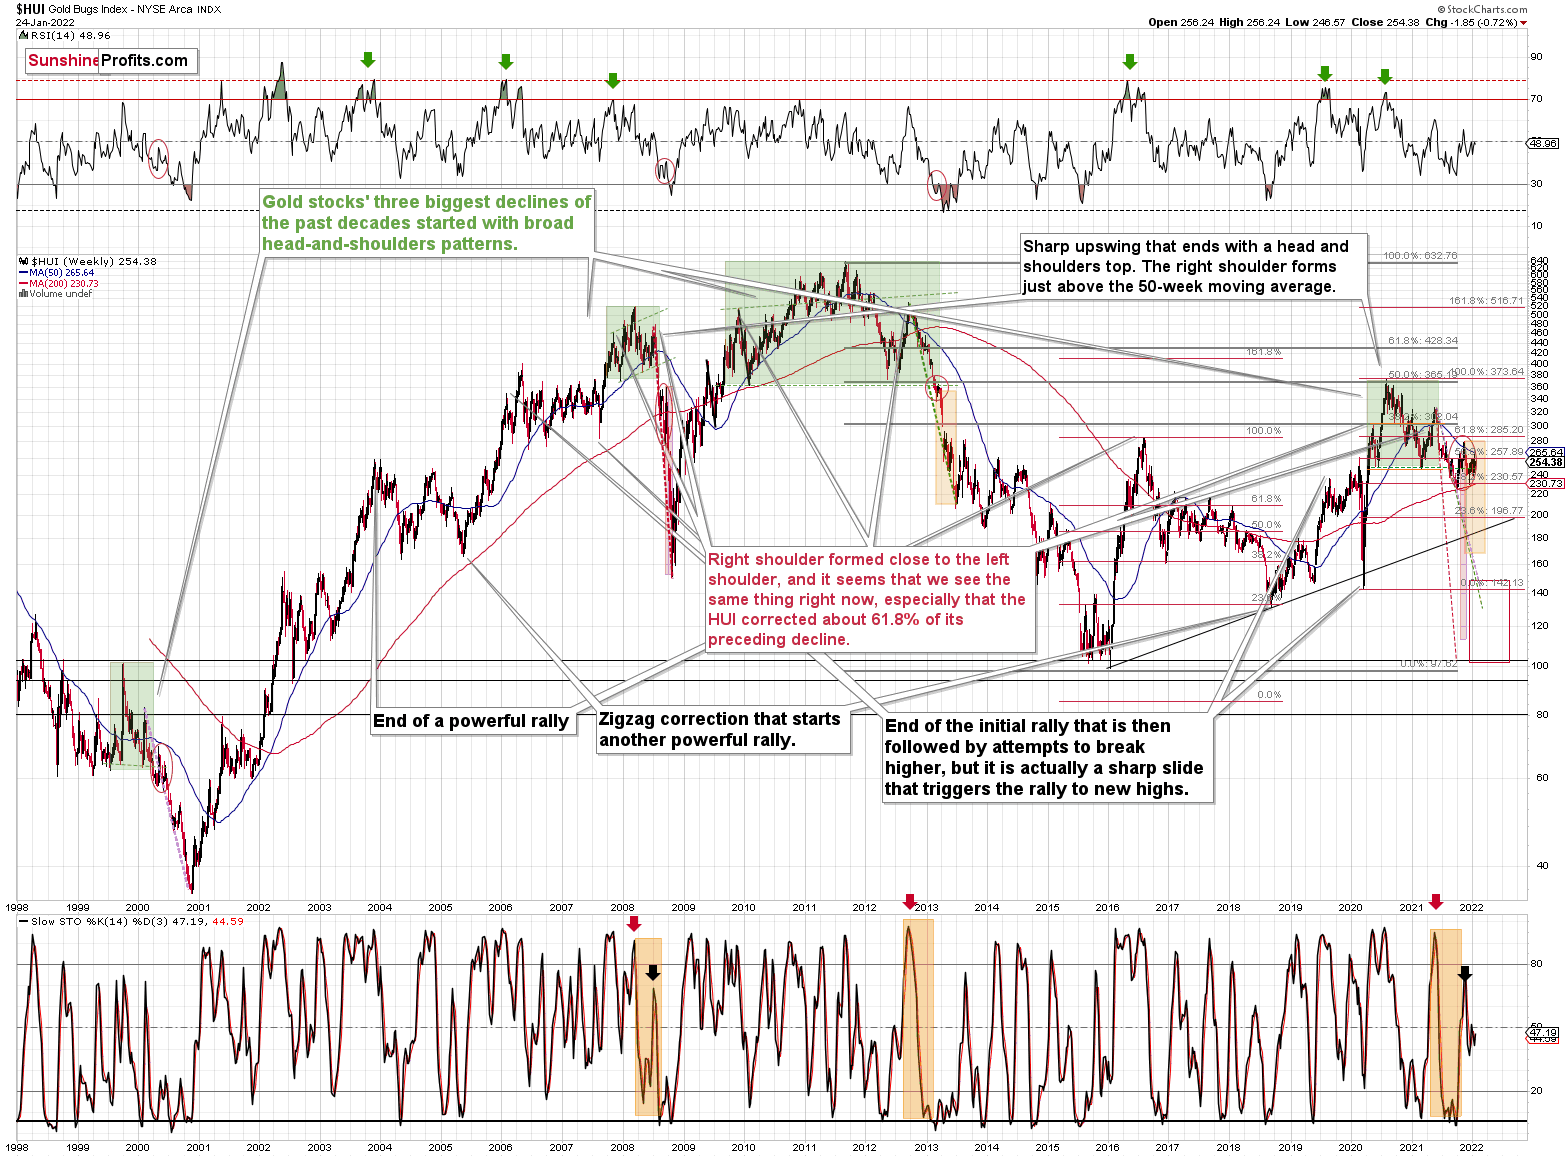
Between its 2000 low and 2002 high, the HUI Index rallied by over 300%, while gold rallied by less than 40%. Now that’s outperformance!
Now, between the bottoms of 2015 and 2016, gold is up by 75%, and the HUI Index is up by about 150%. There is still some leverage (several times less!), but if we compare that to the sizes of the declines and the risk in general, things are much worse.
Gold is now over $400 above its 2016 high. The HUI Index is below its 2016 high.
The HUI Index is below its 2008 high.
In fact, the HUI Index is now even below its 2003 highs! Can you imagine that? Well, you don’t have to imagine it because these are the facts. However, please think about it: gold rallied from about $400 to about $1,800 – more than quadrupling its price, and gold stocks are trading lower.
Based on similarities from previous patterns that were preceded by massive head-and-shoulders formations (marked with green), we can expect to see a massive decline, and the long-term weakness of gold stocks vs. gold provides an excellent background for such a slide.
Want reasons of a more fundamental nature? The rates are going up in the U.S. but not that much in the rest of the world. Consequently, the real interest rates are going up in the U.S. and the same is likely for the USD Index. The two key headwinds for gold are about to blow at full strength.
While gold is likely to decline, given the weakness that gold stocks have been proving over and over again, they are likely to truly slide in such an environment. In particular, junior mining stocks, which have proven to be most vulnerable during the 2020 slide, and also during the recent (and this year’s) declines.
(Click on image to enlarge)
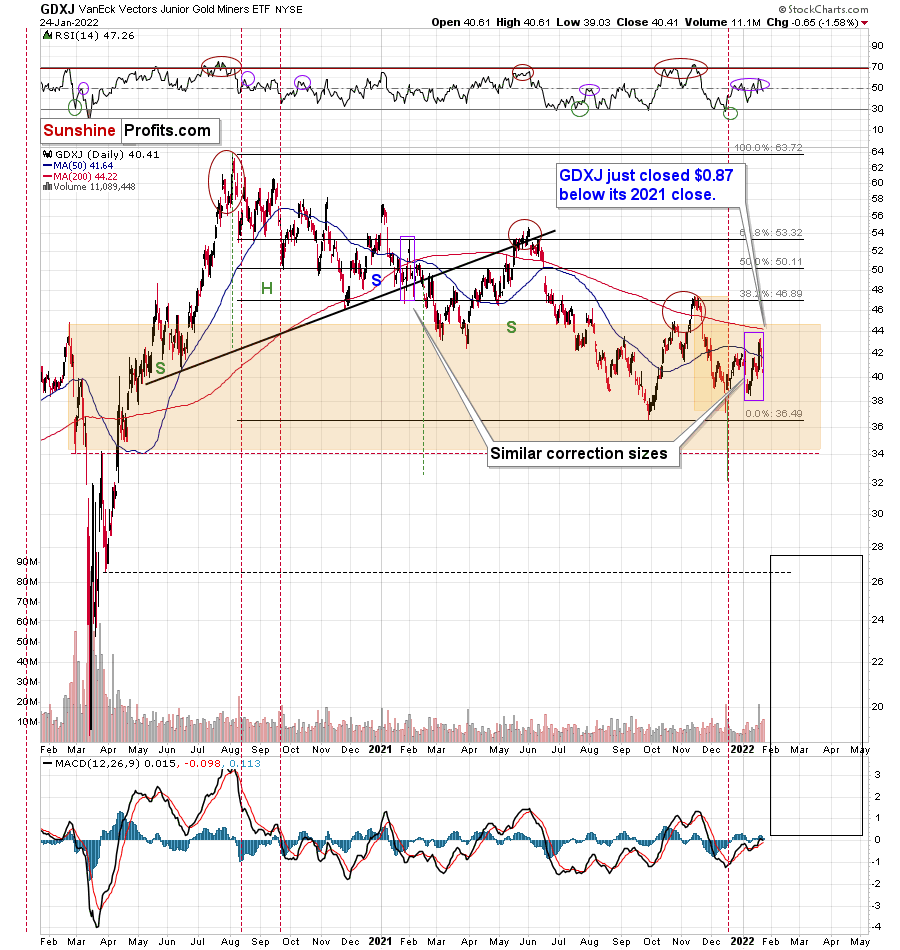
The GDXJ ETF – a proxy for junior mining stocks – declined and reversed some of its declines before the end of the day. This might appear bullish until you factor in the following facts:
- gold closed the day almost $10 higher;
- the general stock market ended the day higher.
Consequently, mining stocks should have rallied yesterday, but instead they declined by over 1.5% anyway. This underperformance is bearish. Period.
Please note the broad red rectangle that I placed on the above chart. It’s there to illustrate the size of the initial 2020 decline.
Yes, junior miners are already below the price levels from which the 2020 started, and if they simply decline as much as they declined back then (so, I’m not asking for anything “completely new” to happen), they could be at $34 in a matter of days.
(Click on image to enlarge)
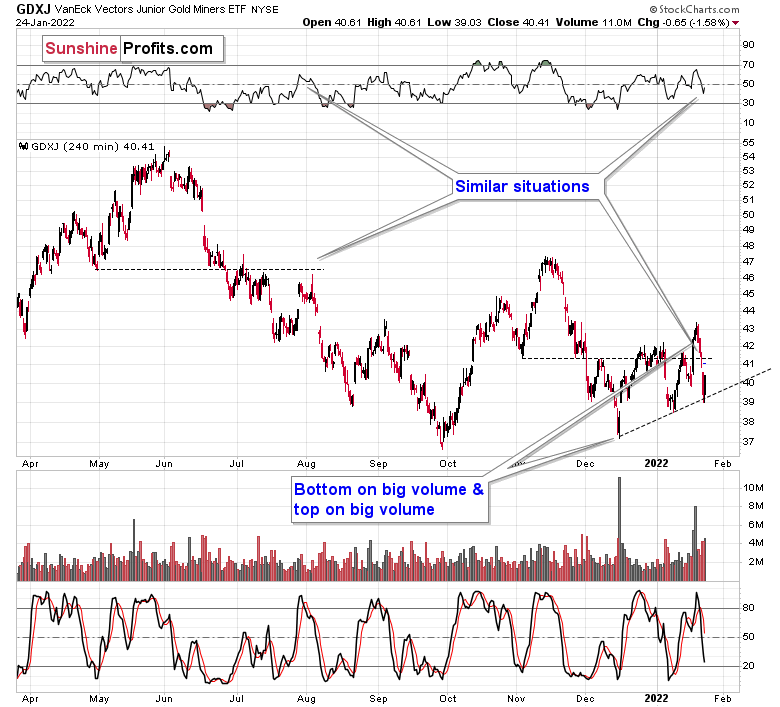
For now, junior miners bounced off of their rising support line, but this doesn’t change the fact that they greatly underperformed gold and the general stock market, which means that the implications of yesterday’s session are bearish.
(Click on image to enlarge)
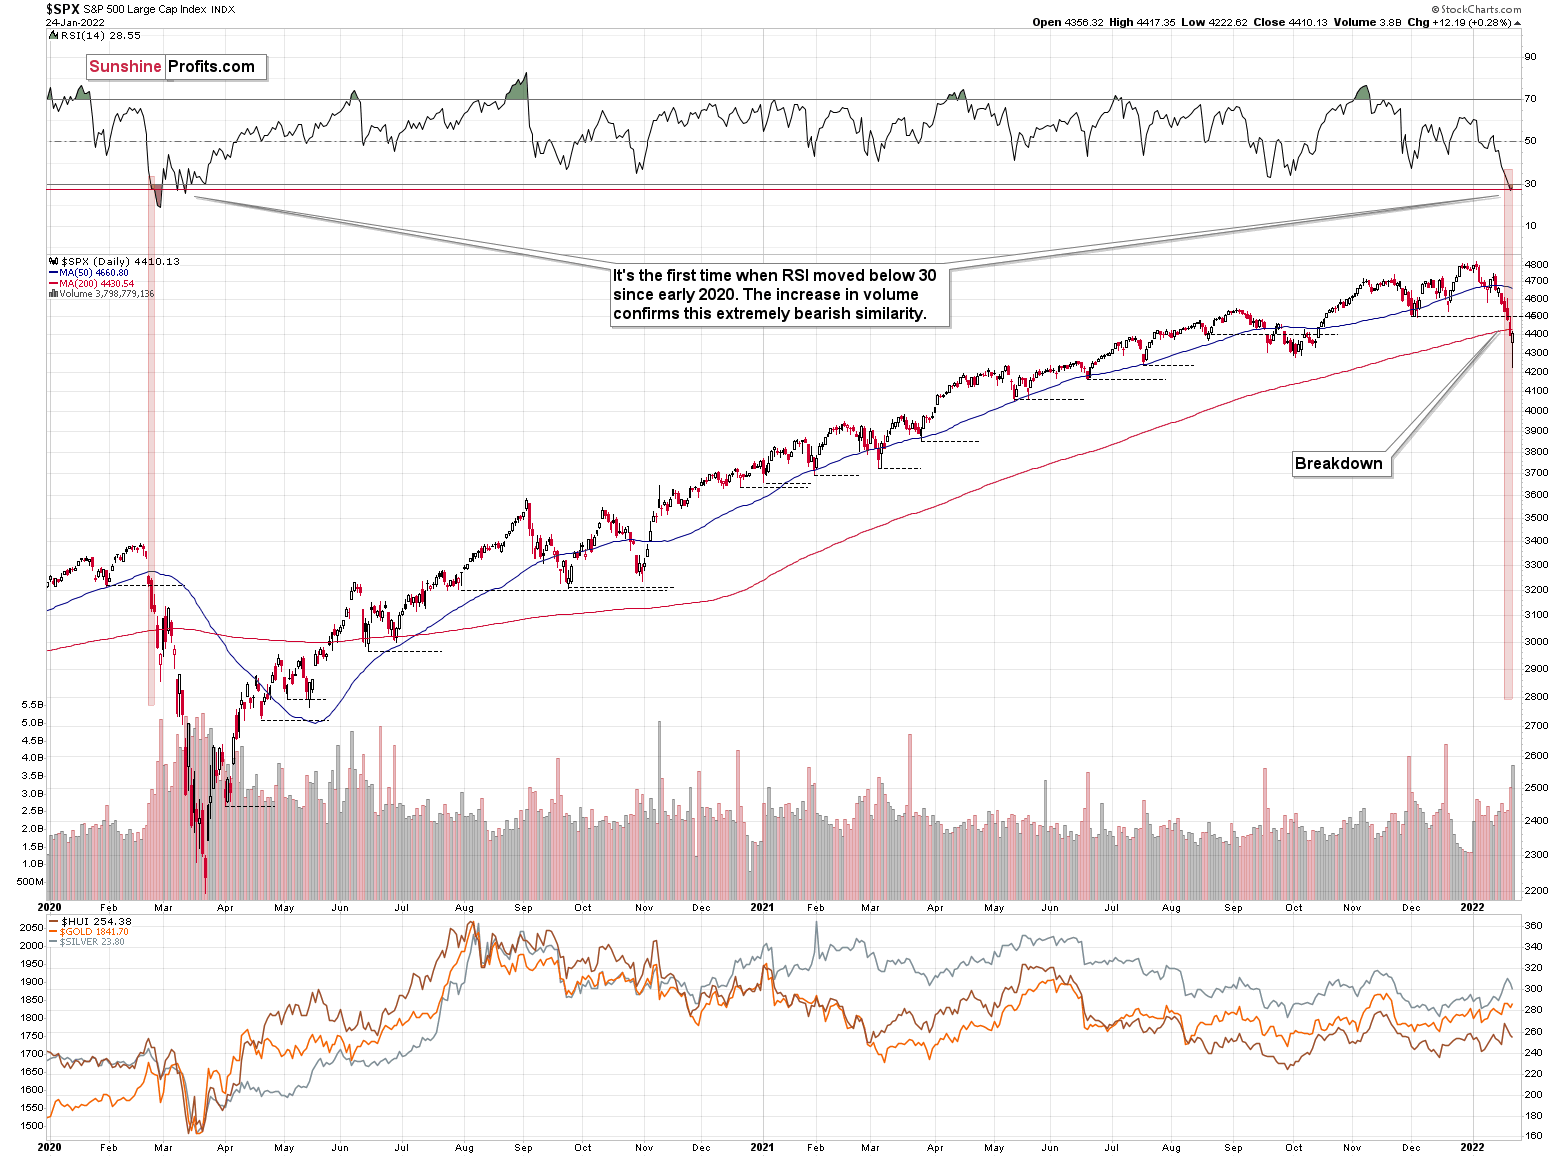
As I mentioned earlier, the S&P 500 declined and then rallied back up yesterday. The daily reversal took place on huge volume, which is bullish at its face value.
On the other hand, however, let’s keep in mind that the early-2020 decline had days of hesitation too. On Feb. 26, 2020, the S&P 500 also moved back and forth, closing only slightly lower. Declines resumed on the following day.
Looking at the RSI, we see that once this indicator moved below 30, it (and the S&P 500 itself) kept declining until it moved below 20. That’s not what happened yesterday.
Also, the initial decline in 2020 took the S&P 500 lower by over 15% before we saw a small corrective upswing. The 2022 decline took the S&P 500 down by a bit over 12%, including yesterday’s intraday low. If history repeats itself to a significant degree, we could see even lower stock market prices before seeing a more visible rebound.
On the other hand, seeing a rebound right away wouldn’t be likely to change anything – it seems that an even bigger, medium-term decline is already underway.
Yes, RSI below 30 is generally considered oversold territory, but the direct analogies take precedence over the “usual” way in which things work in markets in general. In this case, the situation could get from oversold to extremely oversold. Let’s keep in mind that stocks declined very sharply in 2020.
One could say that times were different, but were they really? The key difference is that the monetary authorities are now already after the bullish money-printing cycle and are handling inflation by aiming to increase interest rates, while they had been preparing to cut them in 2020.
The situation regarding the pandemic is not that different either. Sure, back in 2020, it was all new, we had massive lockdowns and there was great uncertainty regarding… pretty much everything. Now, the situation is not entirely unexpected, but given the explosive nature of new COVID-19 cases (likely due to the Omicron variant), it’s still quite new and uncertain.
The uncertainty is not as great as it was back in 2020, but then again, now we’re facing monetary tightening, not dramatic dovish actions. Thus, I wouldn’t exclude a situation in which we really see a repeat of the early-2020 performance, where the declines are sharp and huge. The technicals in the precious metals market have been pointing to that outcome for months, anyway, especially the long-term HUI Index chart that I’ve been discussing previously.


Comments
Log in or sign up to join the conversation.