Gold Might See Larger Degree Correction

Image Source: Pixabay
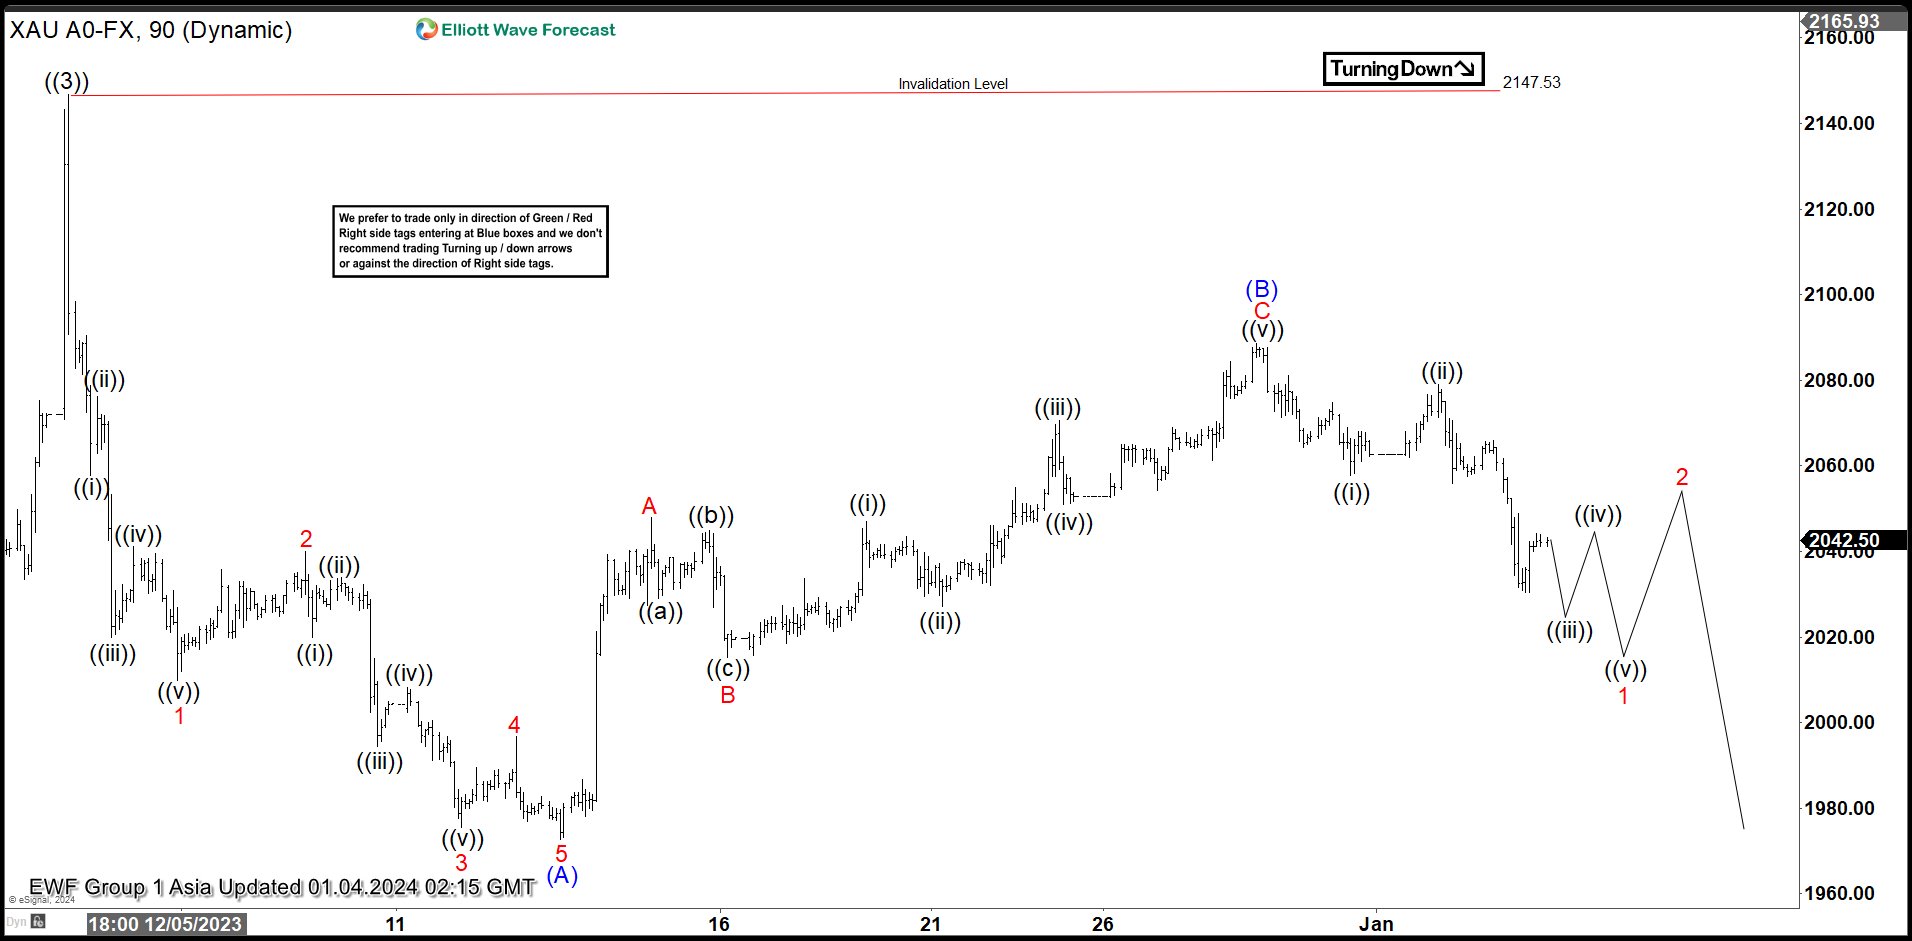
GOLD (XAUUSD) shows a bullish sequence from the September 2022 low favoring further upside. The rally higher from 09.28.2022 is unfolding as the Elliott Wave leading diagonal. Up from 09.28.2022 low, wave ((1)) ended at 2081.82 and pullback in wave ((2)) ended at 1810.58 low. Wave ((3)) finished at 2147.53 high as the 1-hour chart below shows. Pullback as wave ((4)) is currently in progress with internal subdivision of (A), (B), and (C).
Down from ((3)), wave (A) built an impulse structure. Wave 1 ended 2009.78 low and bounced in three swings completing wave 2 at 2039.93. Wave 3 ended at 1975.50, wave 4 ended at 1996.73, and final wave 5 lower ended at 1972.60. This completed wave (A) to a higher degree. Wave (B) pullback developed an internal subdivision as a zig-zag. Up from wave (A), wave A ended at 2047.91, wave B ended at 2015.30, and wave C ended at 2088.48. This completed wave (B) and gold turned lower. Expect the metal to continue to the downside in wave (C) to break the 1972.60 low to confirm the view of the wave ((4)) correction. As far as the pivot at 2147 high stays intact, expect the rally to fail for further downside.
Gold (XAUUSD) 90 Minutes Elliott Wave Chart
Gold (XAUUSD) Elliott Wave Video
Video Length: 00:08:50
More By This Author:
Dow Futures Looking To Extend Higher To Complete Impulsive StructureCameco Should Continue Bullish Trend In 2024
XLV Making Strong Reaction Higher From Extreme Area
Disclaimer: Futures, options, and over the counter foreign exchange products may involve substantial risk and may not be suitable for all investors. Leverage can work against you as well as for ...
more


