
Gold: Looking For Important Clues In Unusual Places

Image Source: Pixabay
My long-time readers know that I am a big fan of ratio charts. That's because the effects of monetary inflation makes the price of just about everything go up in nominal value over time. To figure out whether an asset is in a bull market, you don't just want to see the nominal value increase, you also want to see that asset outperform alternative investment options. After all, if your asset is consistently losing ground to another over time, why would you invest in it in the first place? That's where ratio charts come in.
(Click on image to enlarge)
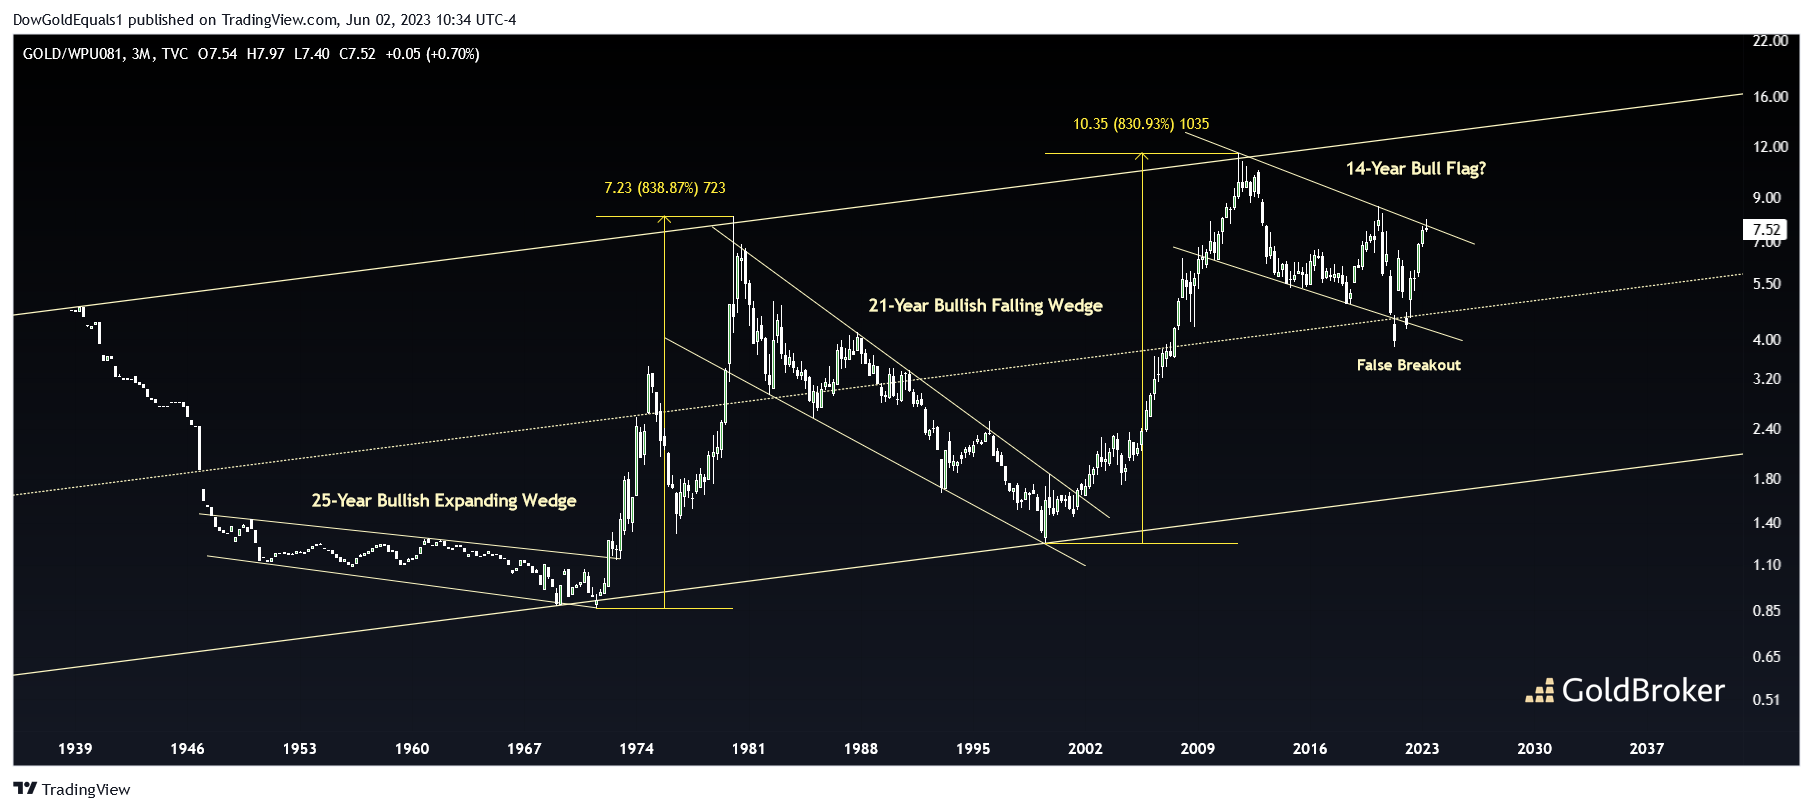
The first chart compares the price of gold to the Bureau of Labor Statistics' Producer Price Index of Lumber and Wood Products. While not an intuitive comparison for many of us to make, we can still make some very interesting observations. First, we note that this chart has provided some stunning technical patterns going back to 1939, highlighted by its long-term trading channel and multi-decade bullish wedges. When price has broken free of those huge consolidations, gold has gone on to not only massively outperform Lumber, but to begin extending bull market moves. Price currently finds itself within a 14-year bull flag, and its false breakout from below may be signaling an imminent breakout to come.
(Click on image to enlarge)
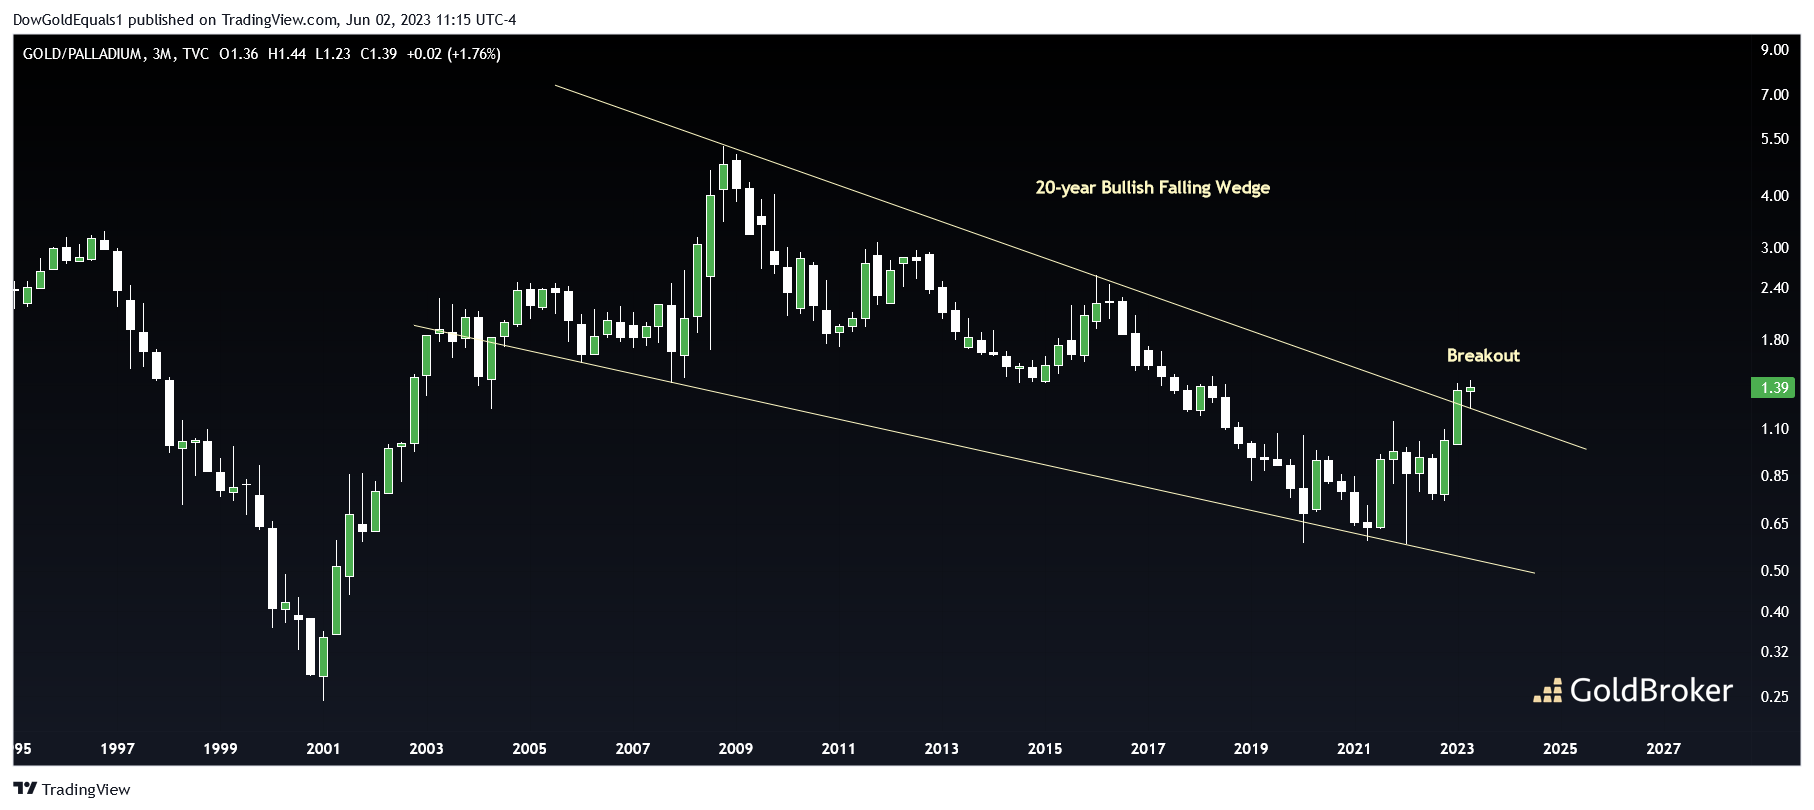
The second chart compares the price of gold to the price of another precious metal, palladium. Price appears to have broken out of a massive 20-year bullish falling wedge, signaling that gold will substantially outperform going forward. We all know what happened to the price of gold when it massively outperformed palladium from 2001-2011.
(Click on image to enlarge)
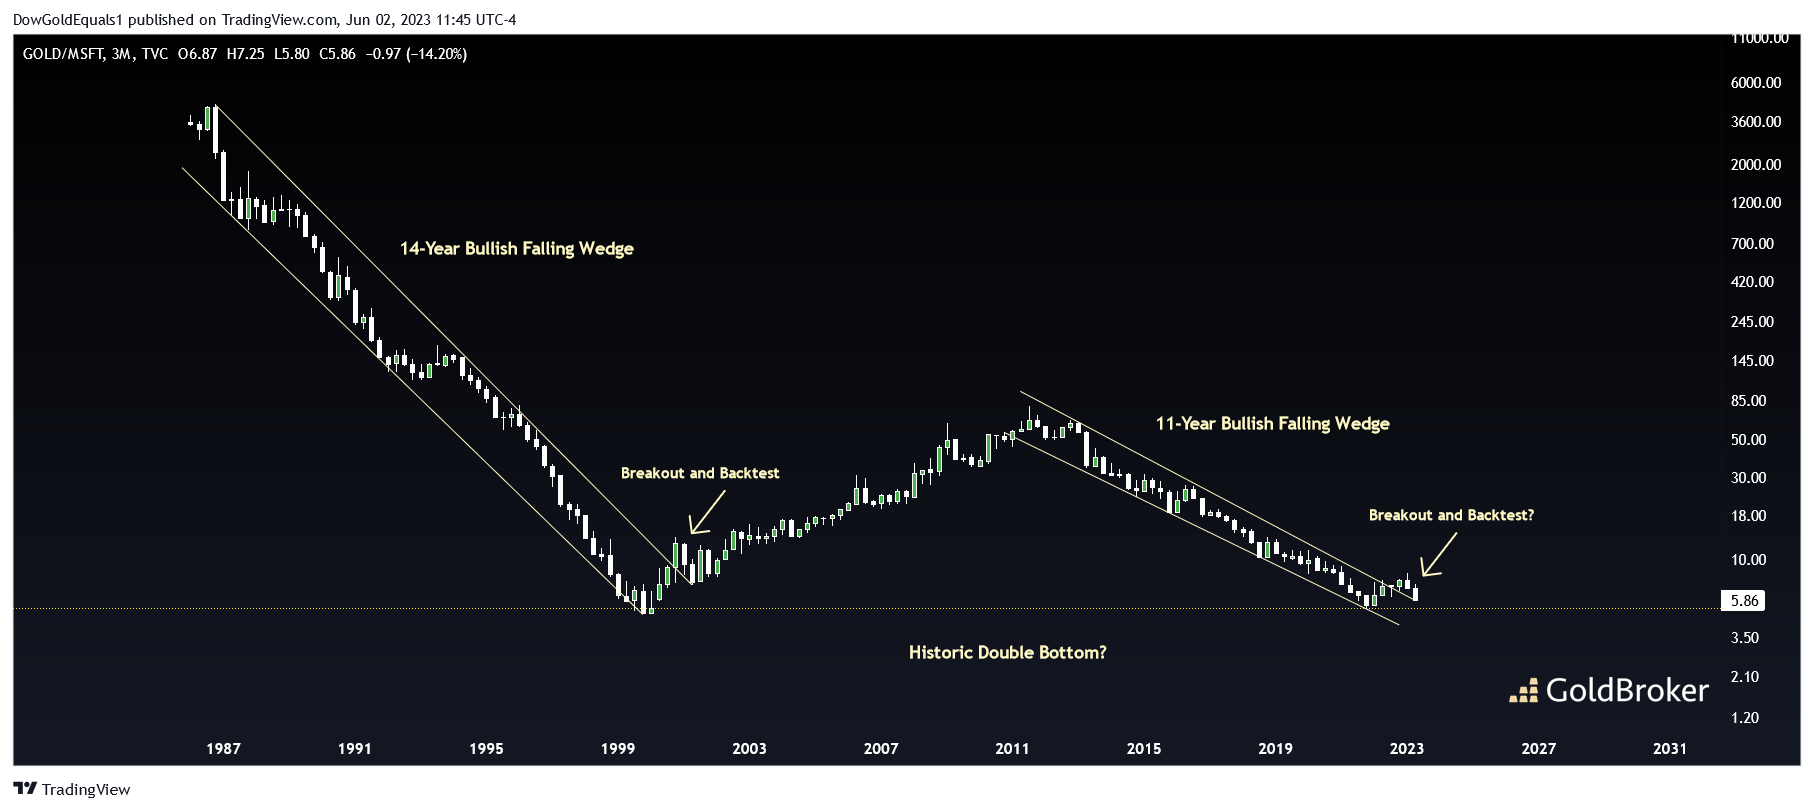
The final chart compares the price of gold to the price of Microsoft (MSFT) stock. When price broke out of a 14-year bullish falling wedge in 2001, a gold bull market was born. Gold has recently broken out an 11-year bullish falling wedge as it also completed a very long-term double bottom. Is the stage now set for gold to outperform as it did 20 years ago? If so, another major bull leg in gold has just begun.
More By This Author:
China Makes Its Mark On The Gold Market
What If CBDCs Became The Only Form Of Currency?
When Will Gold Take Off Against Growth Stocks?
Disclosure: GoldBroker.com, all rights reserved.


