
After the miners' recent confirmed breakdown, gold is also showing signs of the same. Silver ain’t doing better.
Breakdowns are important. Confirmed breakdowns are even more so.
Mining stocks confirmed their breakdown recently, so they were likely to fall. And they just did. The situation has developed in tune with my previous expectations. In yesterday’s analysis, I wrote the following:
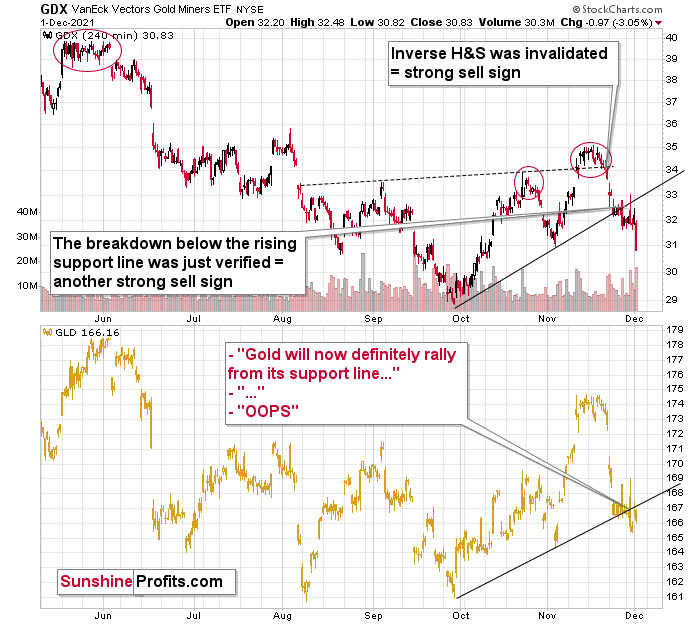
The upper part of the chart features the GDX ETF (proxy for gold mining stocks), and the lower part thereof features the GLD ETF (proxy for gold price itself.)
First of all, gold stocks were first to break below their rising support line – that happened a couple of days ago. Gold moved decisively below its rising support line only yesterday. This emphasizes that gold stocks are leading gold lower. This, in turn, is a bearish confirmation in itself, as that’s what tends to happen at the beginning of a bigger move lower.
The way both markets performed yesterday was also quite interesting.
In case of mining stocks, the intraday rally took GDX just slightly above its rising support line and then miners moved back down in a flash. In other words, if anyone had exited their short positions in order to re-enter them at higher prices, they had very little time to do so, and the most realistic version of this scenario is that they ended the session while missing the 1% decline in the GDX. The silver price was down by just 4 cents, but still, it was a move lower despite an intraday rally.
In the case of GLD, one might have thought that gold was bound to rally since it stopped at its rising support line (based on the Sep. and Nov. lows). And gold even rallied by about $20 intraday… Only to decline more and end yesterday’s session lower.
That was not a reversal. That was a bull trap.
And the most bearish thing about yesterday’s decline – and weakness? It happened while the USD Index moved lower during the day. The USDX ended the day 0.33 lower, which “should have” triggered gold’s rally. Instead, gold declined, proving that it really wants to move lower. And suggesting that profits from one’s short positions in mining stocks are likely to become bigger.
Don’t get me wrong – I do think that we’ll see a counter-trend upswing, but it’s just not that likely that we’ll see it right now. For quite some time, I’ve been repeating that it’s likely that we’ll see some kind of corrective upswing once gold moves back to its yearly lows, and this remains to be the case.
Then, after the rebound, gold is likely to decline once again, perhaps to its final lows (for many years to come).
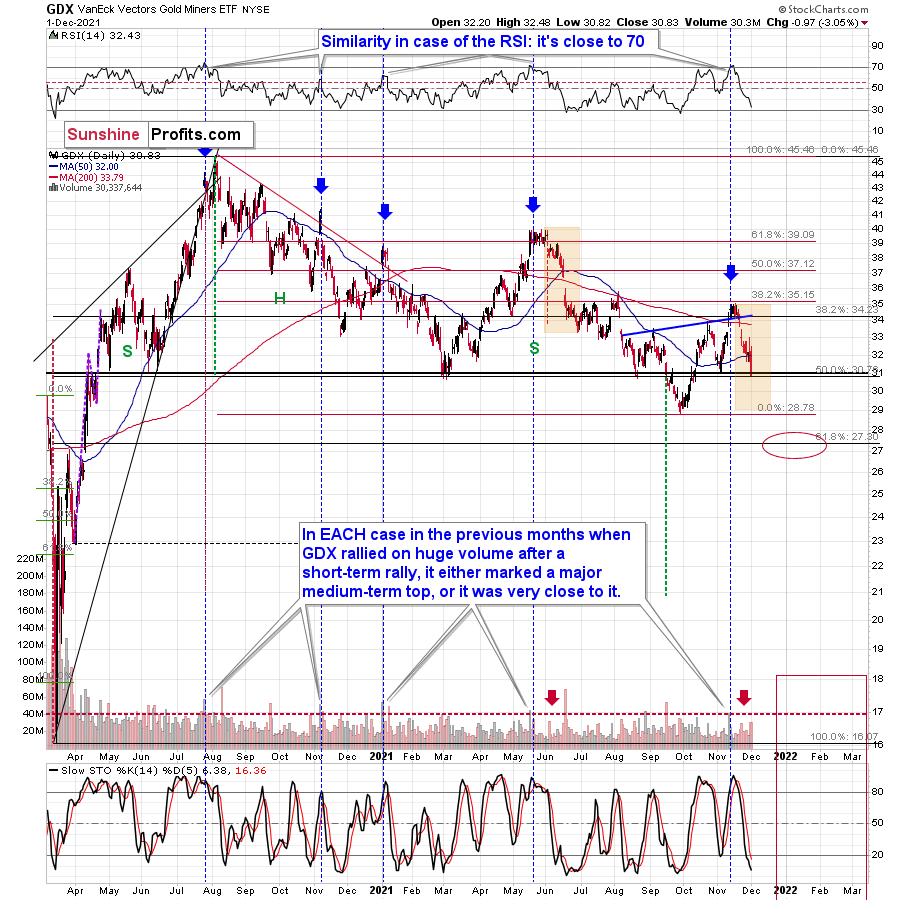
The GDX ETF declined by 3.05% yesterday.
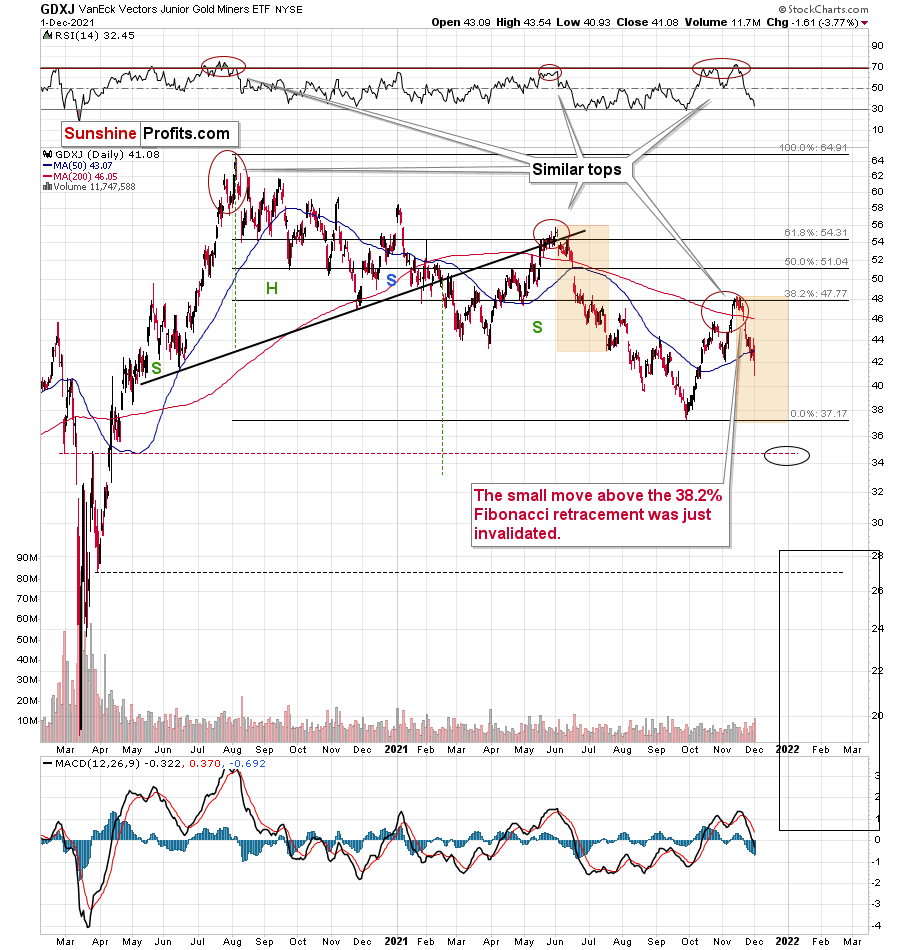
The GDXJ ETF declined by 3.77% yesterday, and I just received the following message from one of the people who were following my analyses: “MY BEST FINANCIAL DAY IN MY LIFE…AND I trust you enjoyed the same success!!!!!!!!!!!!!”
Indeed, I congratulate everyone who was able to patiently wait out the corrective upswing and is now benefitting from the decline. Of course, my congratulations extend also to those who were able to exit short positions earlier and re-enter them at higher prices – it seemed too risky in my view, but some of you might have been able to do it. Congratulations either way.
So, will we see a corrective upswing now? While that’s possible, it’s not imminent. One of the previous situations that’s similar to the current one is what we saw right before the mid-year top. I marked mid-year declines (from the start to the first more visible correction) in both charts: GDX and GDXJ with orange rectangles. If the history repeats itself, both proxies for mining stocks could move back to their previous 2021 lows before correcting.
There’s also an additional (and actually, the foremost) reason to expect decline’s continuation. Today’s pre-market breakdown in gold.
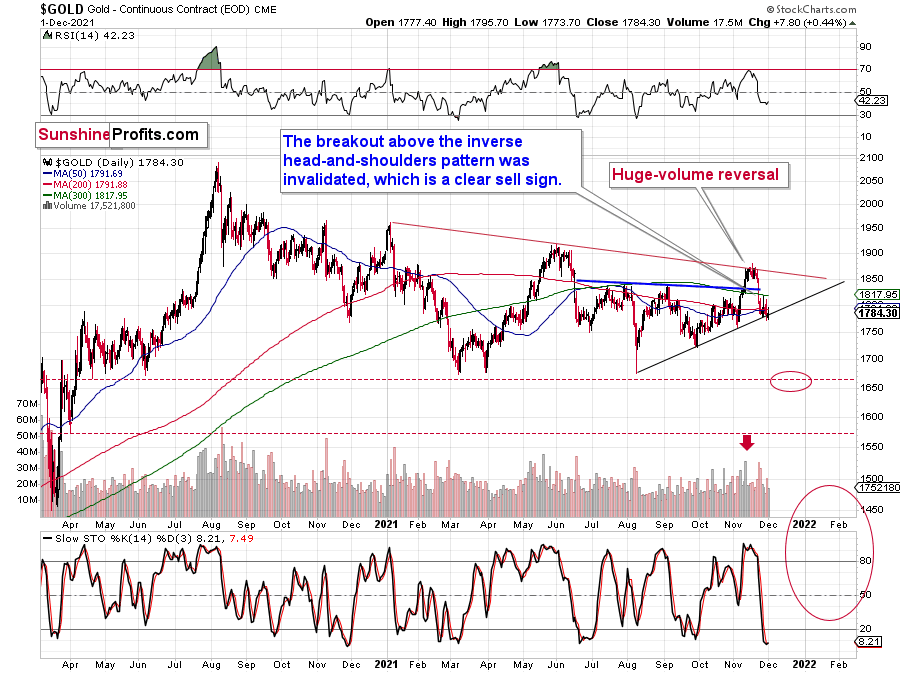
On the above chart it’s not clear if the gold price moved below the rising support line (marked with black) or not, but it is clear on the below chart that also features today’s pre-market trading (up to the moment when I saved the chart that is).
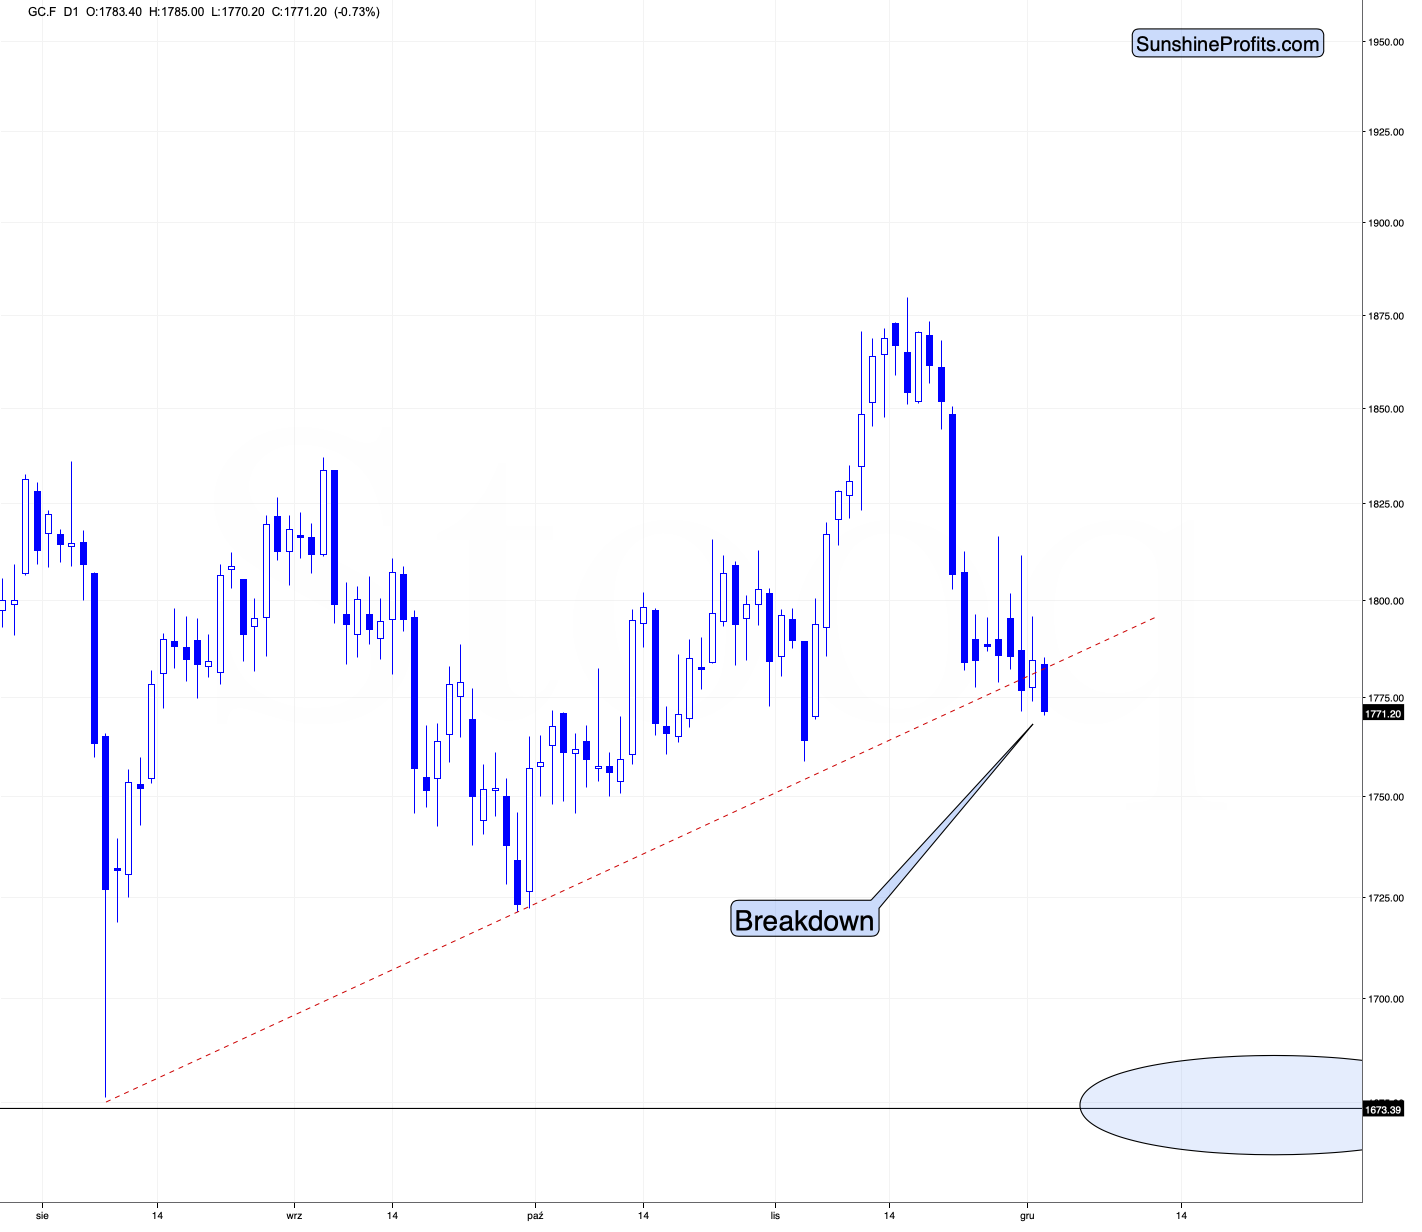
Ladies and gentlemen, we have a breakdown.
It’s not confirmed yet, but given how weak gold was recently – refusing to rally despite USD’s declines – it’s likely to be confirmed shortly.
Silver already declined as well, confirming the general direction of the entire sector:
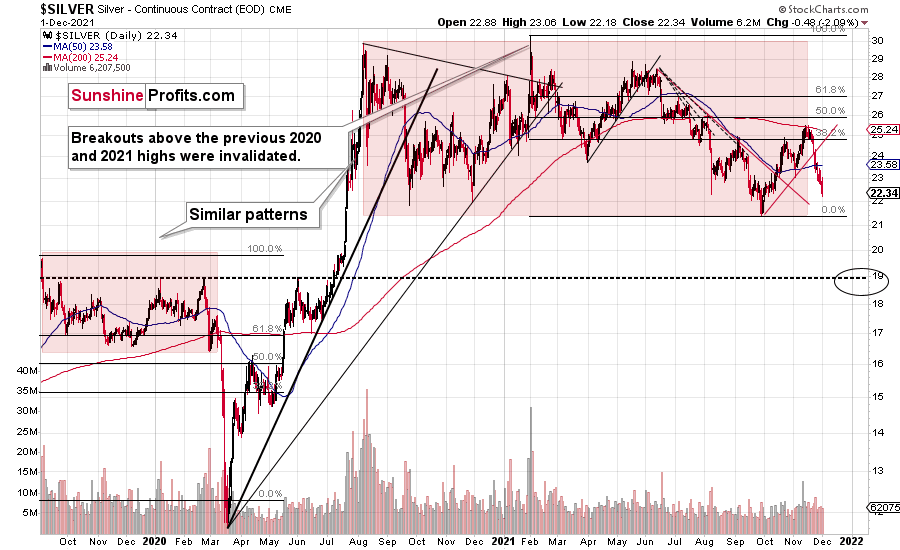
While GDX declined by slightly more than 3%, GDXJ almost 4%, silver was down by about 2%. Compared to the previous decline silver declined more than miners, but not in percentage terms. Counting the percentages from the recent top (November intraday high to yesterday’s intraday low), GDX is down by 12.14%, silver is down by 12.99% and GDXJ is down by 15.17%. The GDXJ still declined the most – in perfect tune with my expectations.
Please note that in 2020, juniors and seniors both declined, but juniors declined more, and they even briefly moved below the price of the seniors (GDXJ moved below GDX for a very short while). If that was to happen once again (and it seems quite likely to me), then it means that junior miners have much greater downside potential – that’s why I’m focusing on shorting this part of the precious metals sector.
Having said that, let’s take a look at the situation from a more fundamental angle.
Time After Time
With the S&P 500 extending its Omicron freak out, battered bulls were left in disarray once again. And with the PMs no longer able to surf the general stock market’s bullish wave, reality has re-emerged once again.
To explain, I wrote on Nov. 11:
While the PMs may have won the recent battle, they’re unlikely to win the war. With inflation surging, markets rattled, The White House rattled and precious metals investors assuming that policymakers will do nothing (even as their anxiety accelerates), the calculus boils down to one fundamental question: do you believe the U.S. dollar or do you believe the PMs?
Please see below:
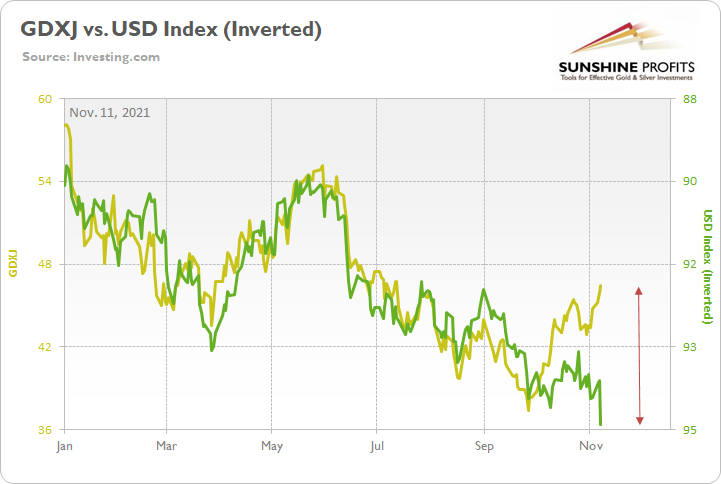
To explain, the gold line above tracks the GDXJ ETF (our short position) in 2021, while the green line above tracks the inverted (scale flipped upside down) USD Index. If you analyze the relationship, you can see that when the USD Index rises (the green line falls), the GDXJ ETF often heads in the opposite direction.
However, with the U.S. dollar betting that the Fed will tighten and the junior miners betting that it won’t, we expect the former to win out over the medium term.
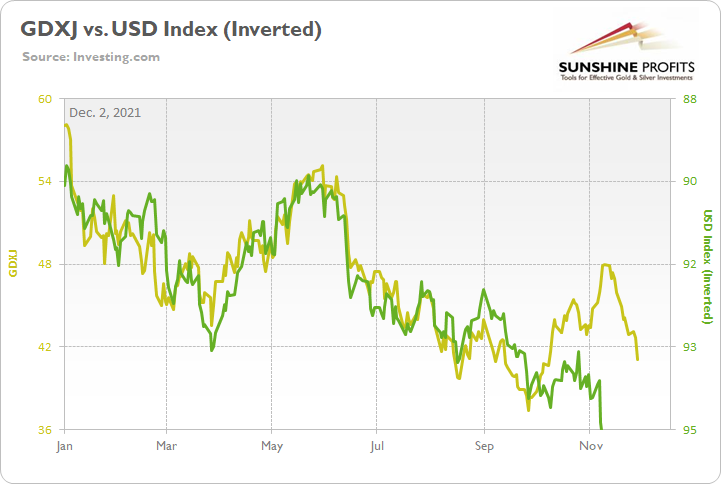
And now, with the USD Index continuing its ascent and the GDXJ ETF reversing sharply, the junior miners faltered in their attempt to run away from the USD Index.
Please see below:
To that point, with investors assuming that 1970s-style hyperinflation would occur with little pushback from policymakers, I warned on numerous occasions that the prospect was far-fetched. And while it may seem counterintuitive, surging inflation is actually bearish for the PMs. And why is that? Well, it’s because willing policymakers can control inflation. And when they perform hawkish shifts, the PMs often suffer mightily.
For context, I wrote on Nov. 12:
With the inflation narrative shifting from ‘no big deal’ to ‘out of control,’ investors had it wrong then, and they likely have it wrong now. Inflation is hot, no doubt about it. But the notion of 1970s-style hyperinflation is much more semblance than substance. The U.S. dollar is rallying (disinflationary), the taper is underway (disinflationary), U.S. Treasury yields are rallying (disinflationary) and the FOMC can raise interest rates without crashing the U.S. economy. As a result, the 2021 theme of ‘USD Index up, PMs down’ should resurface sooner rather than later.
Furthermore, with Fed Chairman Jerome Powell validating the thesis on Nov. 30, the central bank chief essentially admitted that accelerating the pace of the taper is likely a done deal at the FOMC’s next policy meeting (Dec. 14/15). He said:
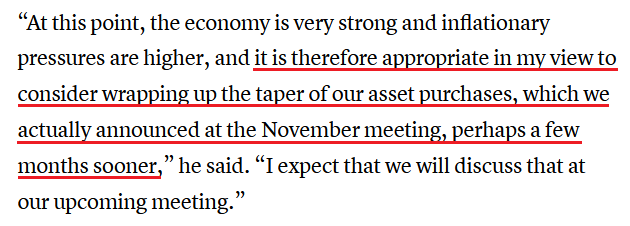
Source: CNBC
On top of that, Powell sounded pretty hawkish during his testimony on Dec. 1. He said:
“Policy has adapted to that and will continue to adapt. We’ve seen inflation be more persistent. We’ve seen the factors that are causing higher inflation to be more persistent….
“We have to balance those two goals [the labor market and inflation] when they are in tension, as they are right now," Powell said. “But I assure you we will use our tools to make sure that this high inflation we are experiencing does not become entrenched.”
For context, it’s clear that Powell, Clarida, Waller and Bostic are all advocating for a faster taper. And now, even New York Fed President John Williams (a major dove) isn’t so sure of his surroundings. Moreover, while he remained evasive on further policy action, he said on Dec. 1:
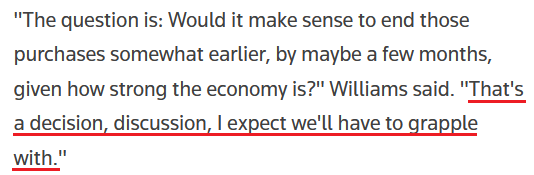
Source: Reuters
And as all of the drama was unfolding, the Fed also released its latest Beige Book on Dec. 1. As it relates to wage inflation, the report revealed:
“Nearly all Districts reported robust wage growth. Hiring struggles and elevated turnover rates led businesses to raise wages and offer other incentives, such as bonuses and more flexible working arrangements.”
For context, Powell also expressed concerns about wage inflation on Dec. 1. He said:
"We have seen wages moving up significantly. We don’t see them moving up at a troubling rate that would tend to spark higher inflation, but that’s something we’re watching very carefully."
And as it relates to input and output inflation, the Beige Book revealed:
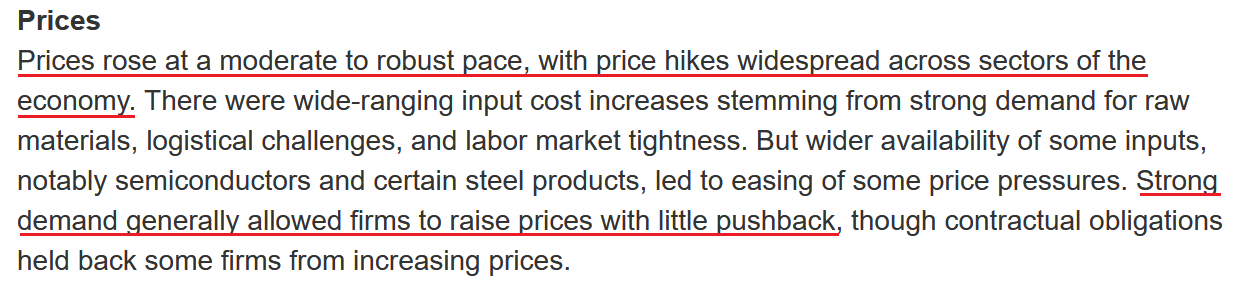
Source: U.S. Fed
Also highlighting Powell’s inflationary conundrum, the Institute for Supply Management (ISM) released its Manufacturing PMI on Dec. 1. And while its prices index decreased from 85.7 in October to 82.4 in November, the report revealed that “raw materials prices increased for the 18th consecutive month, at a slower rate in November” and that “all 18 industries reported paying increased prices.”
Likewise, IHS Markit’s Manufacturing PMI (also released on Dec. 1) had a similar message:
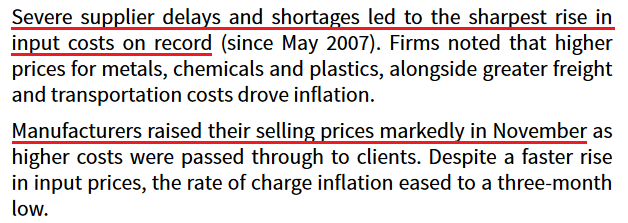
Source: IHS Markit
Also noteworthy, the report was an ominous sign for stock market bulls. For example, demand destruction is already unfolding. If you’re unfamiliar with the term, it means that surging inflation cannot persist forever. Eventually, prices eclipse demand, and consumers stop purchasing the products.
Chris Williamson, Chief Business Economist at IHS Markit, said:
“While demand remains firm, November brought signs of new orders growth cooling to the lowest so far this year, linked to shortages limiting scope to boost sales and signs of push-back from customers as prices continued to rise sharply during the month.
While average selling price inflation eased as firms sought to win customers, the rate of input cost inflation hit a new high, hinting at a squeeze on margins.”
Finally, with inflation running hot and the Fed’s hawkish rhetoric poised to morph into hawkish policy in the comings months, the timing of Powell’s ‘come-to-Jesus’ moment is far from a surprise. To explain, when inflation becomes political, the performance of the PMs, the stock market, or any other asset class becomes a secondary concern. At the forefront, the most important thing for U.S. President Joe Biden is to ensure his political survival.
And with headlines like the one below becoming more common (written by USA Today on Nov. 29), failure to calm the pricing pressures could derail his re-election odds. As a result, inflation is now a net-negative for Biden and Powell, and the USD Index should benefit materially from the upcoming battle.
The bottom line? Surging inflation is doing more harm than good to the U.S. economy, and Biden and Powell recognize this. And with higher precious metals prices mutually exclusive to their goals, the PMs are unlikely to celebrate what unfolds over the next few months.
To that point, I spent a lot of time analyzing the performance of the S&P Goldman Sachs Commodity Index (S&P GSCI). For context, the S&P GSCI contains 24 commodities from all sectors: six energy products, five industrial metals, eight agricultural products, three livestock products and two precious metals.
More importantly, though, it’s inflation’s canary in the coal mine. And with the index declining by 11% in November, there was plenty of wreckage across the commodities complex. Moreover, with the drawdown coinciding with Powell’s recent hawkish rhetoric, more of the same will likely materialize over the medium term.
In conclusion, the PMs were mixed on Dec. 1, though, silver and mining stocks suffered painful contusions. And with Omicron and Powell helping to upend investor sentiment, the PMs face an ominous future. Moreover, while the USD Index takes a breather after its recent sprint higher, the greenback’s fundamentals remain robust. And with Biden and Powell indirectly boarding the U.S. dollar’s bullish train, the next stop is likely ~98.


Comments
Log in or sign up to join the conversation.