
Gold Is Not Going To $10,000
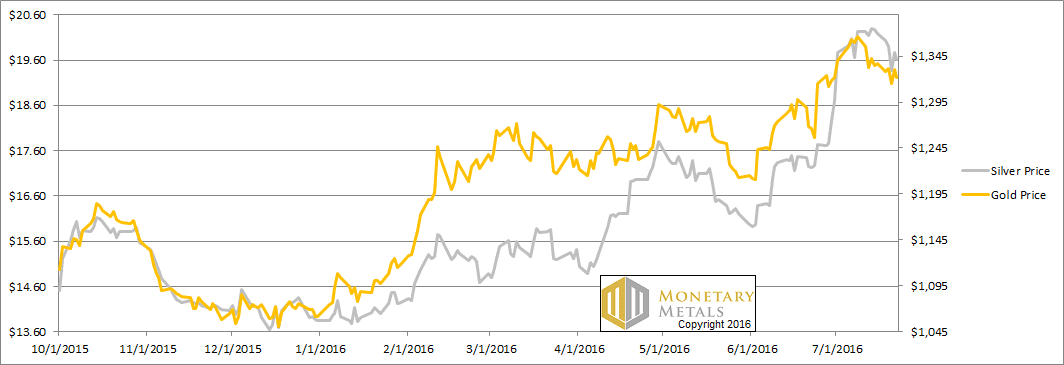
The prices of the metals were down again this week, -$15 in gold and more substantially -$0.57 in silver.
Stories continued to circulate this week, hitting even the mainstream media. Apparently gold is going to be priced at $10,000. Jump on the bandwagon now, while it’s still cheap and a bargain at a mere $1,322!
Our view is, well, not so fast.
Of course, at the end of the day the irredeemable paper currencies will fail. But we have two thoughts to add to this. By the time the US dollar is failing, it will become obvious to everyone that $10,000 is no riches. It will be clear even to the Monetarists that this does not mean gold is going up, but that the dollar has gone down over 7X from where it is now (from 23.5 milligrams of gold to 3.1mg).
Of course, our old refrain is that a lot of price action can occur between now and then. If you’re playing the gold market for dollars, you can’t trade based on the endgame.
So let’s look at the only the only true picture of the supply and demand fundamentals for gold and silver. But first, here’s the graph of the metals’ prices.
The Prices of Gold and Silver
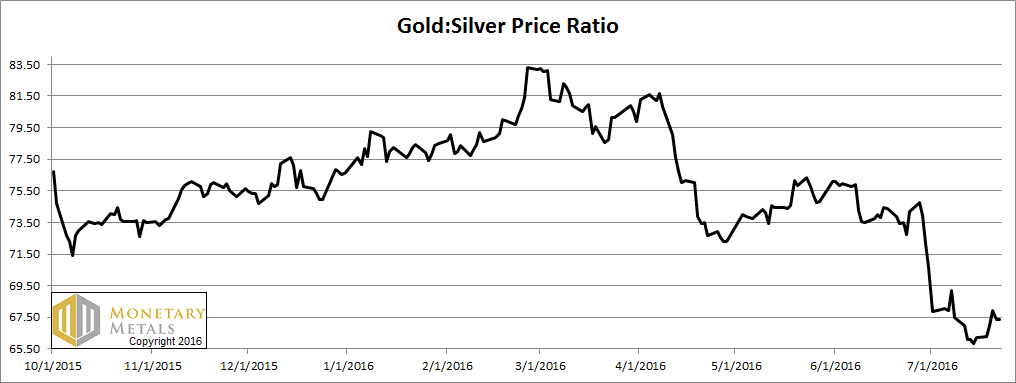
Next, this is a graph of the gold price measured in silver, otherwise known as the gold to silver ratio. The ratio rose this week.
The Ratio of the Gold Price to the Silver Price
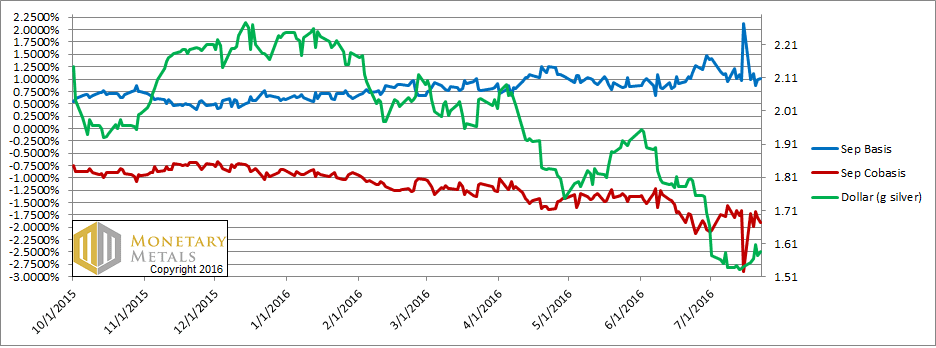
For each metal, we will look at a graph of the basis and cobasis overlaid with the price of the dollar in terms of the respective metal. It will make it easier to provide brief commentary. The dollar will be represented in green, the basis in blue and cobasis in red.
Here is the gold graph.
The Gold Basis and Cobasis and the Dollar Price

Last week, we said:
“We have to say that we are skeptical of the large move up in the basis (i.e. abundance) and downward in the cobasis (i.e. scarcity). We want to see the data for this coming week.”
As is clear on the graph, we were right to distrust these spikes.
The real move is clear (going forward, we will erase the one day with the bad data so the graph will be easier to read). The price of the dollar, in gold terms (i.e. inverse of the price of gold, measured in dollars) is rising. With it, gold is becoming less abundant (blue line, i.e. the basis).
The fundamental price is not buying the $10,000 gold story. Not one bit. It is down around $1,140.
Now let’s turn to silver.
The Silver Basis and Cobasis and the Dollar Price
In silver, it’s even worse as we see a falling scarcity (i.e. red line, the cobasis) as the price of silver falls (inverse to the graph, which shows the price of the dollar, measured in silver). Not counting the anomaly, the silver cobasis fell from -1.66% on Thursday, July 14 to it’s current -1.9%. While the price of the metal fell from $20.28 to $19.62.
The fundamental price is way down, to about $16.
There is so much more to say. Read the full Monetary Metals Outlook 2016 (free registration required). We explore in-depth the points made ...
more


The price of #silver and #gold has recently been affected by #Brexit. In addition, I feel as though that the UK might make a Swiss model deal which entails free trade with the E.U. and Schengen Zone visa privileges which would effectively give the benefits of EU membership minus the voting power and at a lower contribution cost. Also, this would ease market concerns and wipe out the rally that gold has sustained assuming everything remains about the same.