
Gold Hits Yet Another Record Amid Sell-America Trade

Image Source: Pixabay
Gold has entered yet another uncharted territory, surging to a fresh all-time high of $3,500 today, before easing back somewhat. Since hitting a low of $2,956 earlier this month, it’s climbed nearly 18%—a hefty $540 move that’s been driven by a perfect storm of fundamental factors. Uncertainty in global markets, continued central bank buying, dollar weakness, and safe-haven demand are all playing their part. But as impressive as this rally is, investors are starting to ask the inevitable: how much further can it really go? The trend is clearly positive, but the risk of a pullback is growing as momentum reaches increasingly overheated levels. Still, the metal remains in the “buy-the-dip” camp, so any short-term pullbacks should be viewed as a long-side opportunities, unless the trend completely reverses.
Trade tensions keep bulls in charge for now
The primary driver of gold is undoubtedly ongoing trade tensions. The standoff between the US and China has created the kind of economic fog that keeps risk assets on edge and gold bulls firmly in control. Trump’s aggressive tone towards the Fed and renewed tariff threats has only added fuel to the fire, sending the US dollar index to sub-98.00 on Monday, its lowest level since March 2022. Sure, a potential trade breakthrough could deflate some of the haven appeal. But right now, there’s little sign of progress. Until we get more than vague rhetoric, investors are likely to keep doing what’s worked—buying dips in gold. Still, at $3,500, gold isn’t cheap. Any whiff of optimism in risk markets could trigger some sharp profit-taking. But given the strength of the trend, don’t expect any correction to be smooth or one-directional.
Gold technically analysis: Overbought, but does it matter?
The technical backdrop on XAUUSD chart is clearly bullish – you don’t need me or any indicators to tell you that. But there’s no ignoring the warning signs.
(Click on image to enlarge)
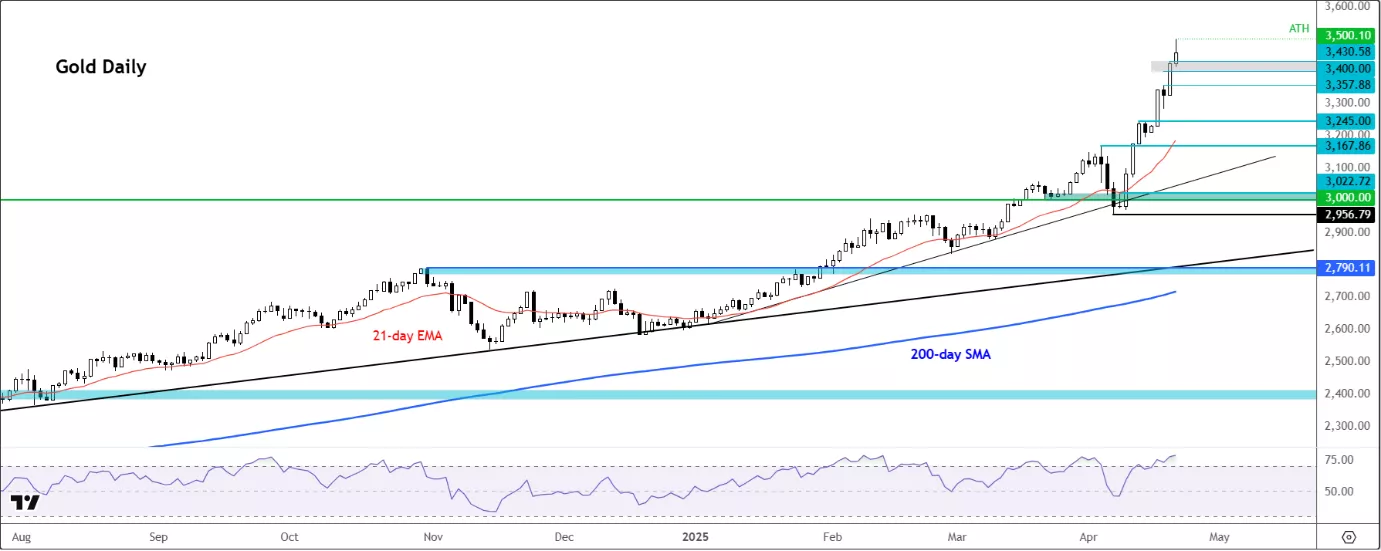
The RSI is pushing 80 on the daily and well above 80 on the weekly—classic overbought territory. The monthly RSI near 87 is reminiscent of previous cycle tops in 2011 and 2020. Even more striking is the distance from the 200-week moving average—over $1,400, or roughly a 67% premium. While the macro backdrop may support elevated prices, this type of divergence rarely lasts forever without at least a period of consolidation.
(Click on image to enlarge)
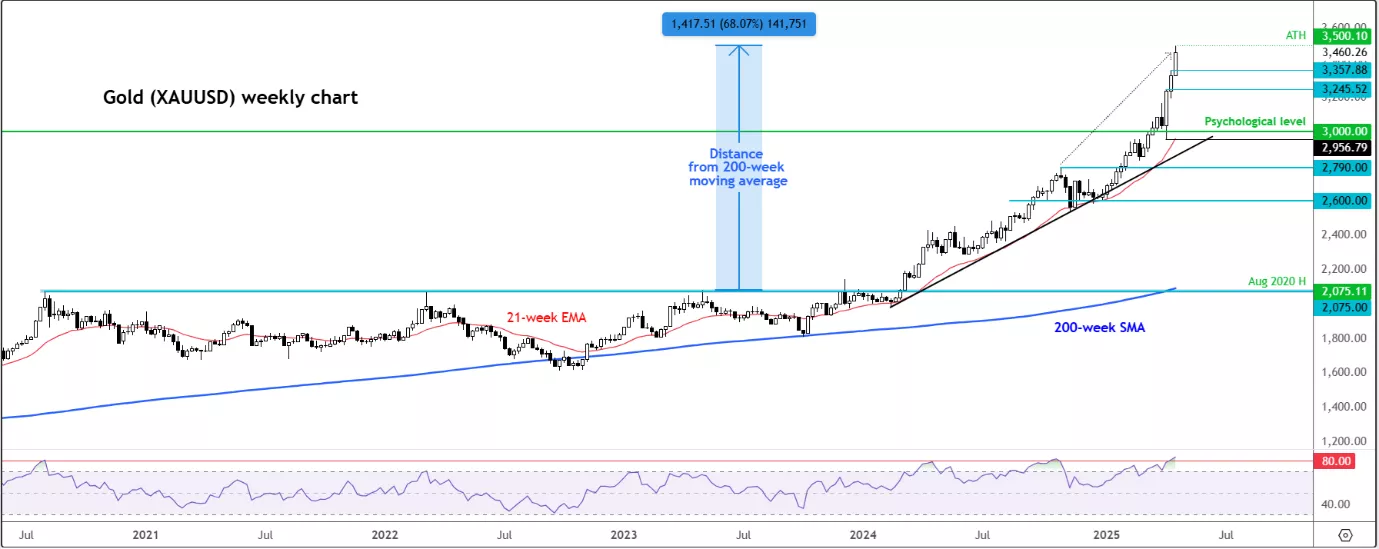
Without a clear reversal pattern or a series of lower highs and lower lows, the gold forecast remains bullish. But that doesn’t mean traders should get complacent. Any daily or weekly reversal candle with downside follow-through could signal a shift in tone.
Support levels to watch:
- $3,430 (recent high)
- $3,400 (round number)
- $3,357 (last week’s breakout point)
- $3,245 and $3,167 (prior resistance zones)
- $3,000 and $2,956 (major psychological and technical levels)
On the flip side, there are no obvious resistance levels above $3,500—only the next round numbers like $3,600 and $3,700.
Bottom line
Gold is hot—maybe too hot. The fundamentals still support the rally, but the market is entering a more mature phase of the rally. As long as the trade war drags on and global uncertainty persists, dip buyers will dominate. But if sentiment shifts or momentum fades, don’t be surprised if gold takes a breather. This doesn’t necessarily mean the end of the bull market, but it’s a reminder that even the strongest trends need a pause.
More By This Author:
Nasdaq 100 Drops As Nvidia Leads Techs Lower Amid Trade War UncertaintyTariffs Reprieve Weighs On Gold But Downside Could Be Limited
Trade War Triggers Fresh Wobble In Stocks As S&P Tests Major Support


