
Gold: Haven Demand Appeal Diminishes On Ukraine Optimism

Image Source: Pixabay
Gold rebounded in the first half of Monday’s session after a relatively sharp drop on Friday. The rebound was not driven by any specific factors, especially with the US being out on holiday and the macro calendar quite quiet. With prices now back around the pivotal level of $2900, what gold does here could set the tone for the next few days at least. Friday’s bearish-looking price action warrants caution, while the lack of downside follow-through so far in the session means dip-buying remains the dominant theme in gold. But the question remains whether prices will further retreat in the short-term outlook from severely overbought levels, or whether gold will try to reach for $3000 mark first.
Was Friday a key reversal day for gold or a mere dip?
On Friday, the price of gold turned sharply lower on the session, after failing to break the record high of $2942 that was set earlier in the week. It reached a session high of $2940, before slumping $63 to a session low of $2877. On the way down, it broke a key short-term support area around $2900 to $2905. This area was now being tested from underneath, which may turn into resistance. For as long we now don’t close back above this area, the bears would feel they may have gained some control of short-term price action, in light of Friday’s reversal-looking price action, when the metal formed a bearish engulfing candle on the daily chart.
(Click on image to enlarge)
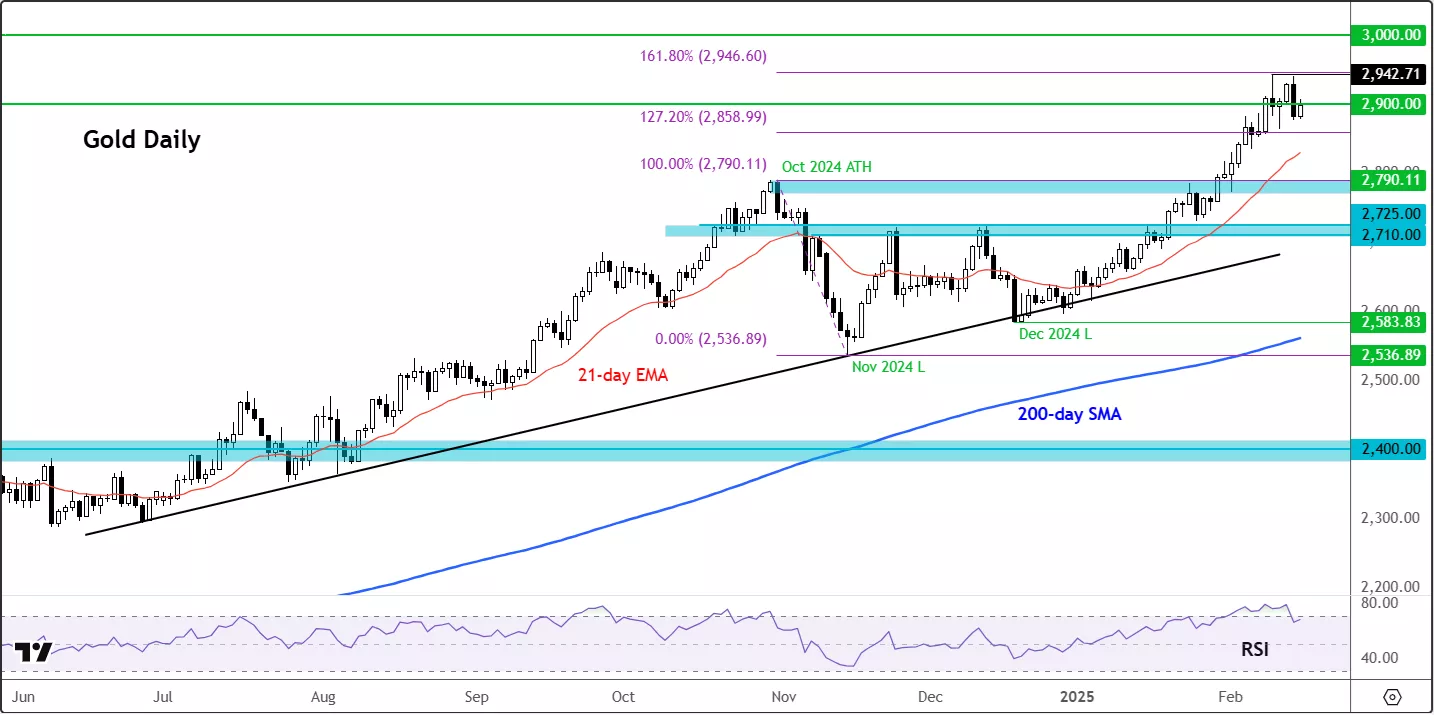
Despite Friday’s reversal, gold remains firmly in an uptrend, consistently setting new highs. However, signs of exhaustion have now started to emerge. Let's see how much further selling pressure the bears can bring here, if any.
The price of gold had reached extreme levels, as per the Relative Strength Index (RSI), which was flashing overbought signals across multiple timeframes. The daily RSI was sitting near 78 before Friday’s drop, which has sent it to just below 70.0
To make things worse, the weekly RSI remains around 75, showing a negative divergence with the underlying price of gold (making lower high relative to last week’s higher high in gold prices). The negative divergence can be a sign of weakening momentum.
Meanwhile, the monthly RSI is around 80.
These RSI levels suggest that a pullback or consolidation may be on the horizon, which may now be underway after Friday’s bearish reversal pattern. Yet, the lack of renewed selling pressure is keeping many bears away – for now.
Still, the long-term overbought RSI conditions, and Friday’s price action, serve as a warning for the bulls to remain vigilant, and that one should not take anything for granted in trading.
So, what is driving all this volatility in gold?
It looks like the US dollar is at the centre of the action. Despite hotter-than-expected inflation data last week, the greenback softened following Trump’s more measured stance on tariffs, while the euro found support amid his expressed willingness to end the Ukraine conflict.
A look at the DXY chart reflects this shift, showing a pullback in the dollar index as market sentiment adjusted to these developments. Previously, gold was ignoring all the dollar strength and was rallying, breaking the historic negative relationship. Gold’s decoupling from that trend seems to have been the reason why it fell so sharpy on Friday.
All this begs the question whether this the start of a long overdue correction.
To be fair, gold needs a correction in the near future to remove some speculative froth, especially with when you consider Trump’s declaration that he intends to bring an end to the conflicts in Gaza and Ukraine raises the prospect of reduced haven demand, should he succeed. At the same time, his protectionist stance and expansive spending plans could keep US inflation elevated, delaying rate cut expectations and lending support to bond yields.
More By This Author:
USD/JPY Extends Recovery Ahead Of US CPI
Gold Hits Fresh Record On Trade War Tensions
Nasdaq: Amazon Results Loom After Poorly Received Alphabet And AMD Earnings


