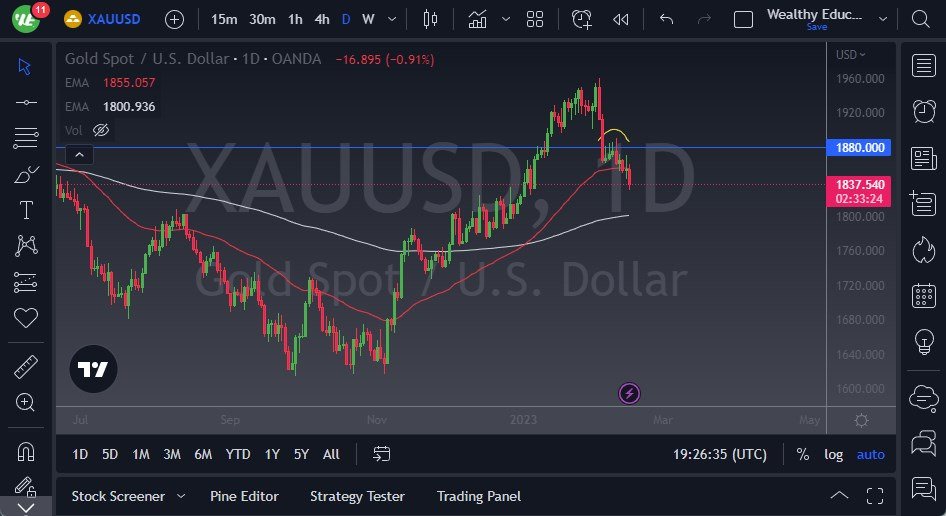
Gold Forecast: Downwards Pressure Fades, But A Break Below $1830 Will Suggest $1800
- The gold market has fallen again during the trading session on Wednesday, as we continue to see a lot of pressure in this market.
- It’s been a bit of a surprise, because at one point it looked like gold was never going to fall again.
- However, coupled with gold we had a massive move lower, the type of move that is almost never found in a perfect vacuum.
- In other words, there were more sellers coming.

$1800 Potential Target
Last week we ended up forming several inverted hammers in a row, which of course is a very negative sign. We then broke down and now we continue to drift lower in general. As the US dollar continues to try to strengthen in general, that will put some negative pressure on gold. Whether or not the longer-term correlation holds remains to be seen, but it is one that’s well-known so I would imagine at least in the short term you have to look at it through that prism.
The 200-Day EMA is close to the $1800 level, and I think a lot of people would be looking at that as a potential target. I don’t necessarily believe that it means anything more than a lot of lazy number of traders will be bothered with it, but it will create some type of reaction would be my guess. With that in mind, I think it’s a situation where we probably have a little bit of follow-through, but ultimately, we more likely than not will see buyers come back as they try to protect their wealth in a very uncertain environment.
On the upside, there is a whole world of hurt waiting at the $1880 level, where we’ve seen a lot of selling pressure. That selling pressure extends to the $1900 level, so above there would be difficult to reach. If we do, then I think we had back to the recent highs near $1960. Alternatively, if we were to break down below the 200-Day EMA at the $1800 level, then it’s likely we go down to the $1750 level given enough time. Ultimately, I do think that there are buyers underneath that we clearly have not found them quite yet, so it’s probably going to continue to be a very noisy affair to say the least. Regardless, be patient and wait for clarity.
More By This Author:
S&P 500 Forecast: Expect Chop Around Within Flag Chart Pattern, 4200 And 4000 Are Levels To WatchS&P 500 Forecast: Will Traders See A Bear Market Rally? Watch The 4000 Handle
USD/JPY Forecast: Continues To Find Support
Disclosure: DailyForex will not be held liable for any loss or damage resulting from reliance on the information contained within this website including market news, analysis, trading signals ...
more


