
Gold: Entering Predator Territory
Gold: Fundamentals
The sentiment of the gold market is extremely bullish. Usually, the VC PMI is a contrarian indicator. Gold is breaking out and people are calling ridiculous numbers of $10,000 and $20,000 an ounce. Most people have no idea what it means economically for gold to be at $10,000 an ounce. It would be chaos for most people.
The market collapsed recently; 38% from the highs on coronavirus fears. What would happen if gold was at $5,000 an ounce? How would the average person handle such a crisis? Most people are not aware of what is going on. Many people have lost their jobs. Their company is going out of business. They can’t pay the rent, yet the stock market is going up. There is a disconnect between Wall Street and the virtual economy that was created in March. That was the first time we started to trade the stock market 100% virtually. For the average person, particularly for those who are not savvy about technology, this is a complete change in paradigm. This is going to force people to be more connected with technology. Algorithms became very prominent because of the velocity of computers to calculate. Traders used to calculate charts by hand. Now computers can do it almost instantly. We are trying to create awareness about this change. Learning about gold and the VC PMI provides you the chance to use this opportunity - which it really is - to change your life. It is up to you to see what is best for you as a self-directed individual. We have used the VC PMI for years to trade effectively. Now is a great, historic time to share this algorithm that can be used by traders to better their lives. Most technical analysis out there can be found free online. We are trying to teach how individuals can use an algorithm to take advantage of this crisis.
We are still trying to understand the damage that was caused by the pandemic. The world is facing a potential depression. The mortality rate may have been exaggerated. So, there are a lot of questions still unanswered, and questions about the decisions that were made in terms of global health and economically. The result is that the system is broken. The system was burdened by massive, unsustainable debt. Fundamentally, there are many things to try to understand and we may never understand it all. The price action of the market is key to trading at such times by telling you what really is happening and what to anticipate. It is clear that the metal markets are saying that all of the stimulus coming into the market is going to be bearish for the dollar and be detrimental to the value of the US dollar as the world’s reserve currency. Therefore, long term, it will be bullish for the metals.
We use the artificial intelligence of the Variable Changing Price Momentum Indicator (VC PMI) to trade the market.
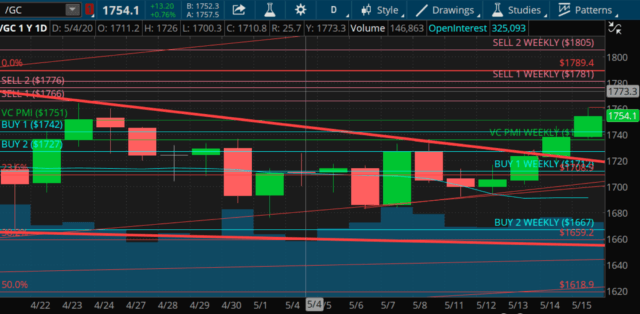
Gold closed at about $1,754.10 on Friday. The VC PMI identifies the weekly average price. The VC PMI also identifies two levels above the mean, which are the Sell 1 and 2 levels. The Sell 2 level is $1,805. The Buy 1 level, which is one level below the mean, is $1,714. The Buy 2 level or the Sell 2 level is two standard deviations from the mean, whereas the Buy 1 and Sell 1 levels are one standard deviation from the mean. The VC PMI identifies the buy levels as areas where we are likely to find strong support or buyers coming into the market. The structure identifies supply and demand for day, swing, position, and long-term traders. As we come into Monday, we can use these specific numbers to identify the extreme levels above and below the mean. The methodology is the same whether it is a daily, weekly, monthly or annual chart. On the right is the weekly data. The VC PMI acts as a GPS to guide your trading, and where buyers and sellers are highly likely to come into the market.
(Click on image to enlarge)
Courtesy: TD Ameritrade
Since the average price is $1,736 and the market closed above that average price, the bias as we come into next week is bullish. If the price reaches the Sell 1 level of $1,781, this would complete the target of this bullish bias. As we come into next week, on Monday, you have a good idea of the setup for the rest of the week. If the price reaches the Sell 1 level, there is a 90% probability that gold will revert back to the mean if activated, and if gold reaches the Sell 2 level of $1,805, there is a 95% probability that the market will revert back to the mean of $1,736.
On the left of the chart are the daily numbers. These numbers change on a daily basis, and we provide our subscribers at the Equity Management Academy with the new numbers the night before each trading session. The average daily price is $1,751, the extreme level above that average price is $1,766 (Sell 1) and the Sell 2 level is $1,766. The Buy 1 level is $1,742 and the Buy 2 level is $1,727. The daily probabilities are the same as the weekly: the Sell 1 and Buy 1 levels have a 90% chance of the market reverting back to the mean from that point. The Sell 2 and Buy 2 levels have a 95% chance of the market if it reaches those levels, of reverting back to the mean of $1,751.
As we come into next week, the daily targets are $1,766 to $1,776. The weekly target is $1,781. If you don’t have a position, you can wait for the market to reach these price targets, and then see what it does. From the daily level of Sell 1 or 2, you would go short if activated. The extreme below $1,751 is $1,742 and then falls into the weekly average of $1,736, and below that $1,722 and the weekly Buy 1 level of $1,712.
The weekly signal is in a bullish price trend momentum. It automatically has the target of $1,781. The daily average price is $1,751. With the market closing at $1,754, we are coming into this week with a bearish price momentum because it closed below the average. So we have a bit of a mixed signal between the daily and weekly. But the VC PMI gives us a structure of where the market is likely to go if it reaches certain levels.
Monthly And Annual Levels
We also use monthly data. The average for the month is $1,686. The extreme level above the mean, Sell 1, is $1,797. The Sell 2 level is $1,899. The extreme level below is $1,584 and the Buy 2 level is $1,474.
(Click on image to enlarge)

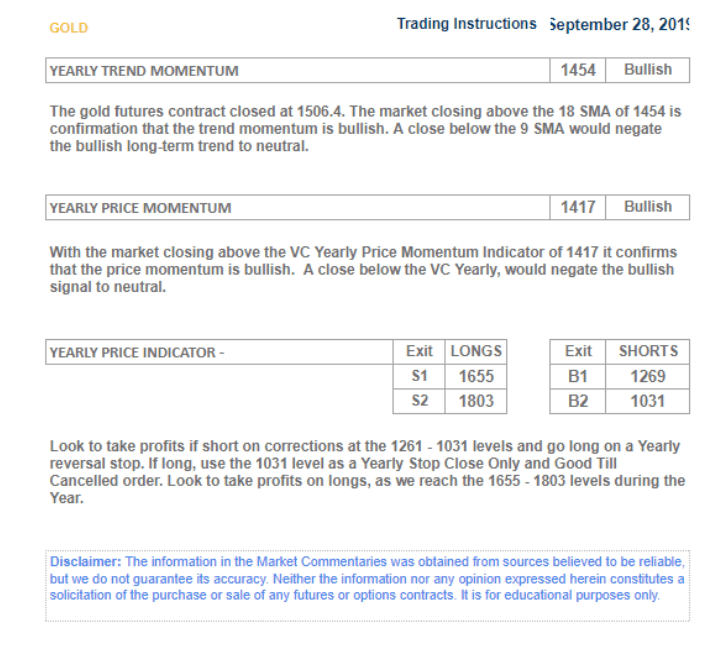
September 28, 2019
(Click on image to enlarge)

On the right of the chart are the annual numbers, which was published on Seeking Alpha on September 28, 2019. Gold was at about $1,506 at that time. It forecast that the first target annually is $1,655, which we have completed with a high of $1,761.50 as of Friday. We use a 15-minute bar to trade, and which activates the trigger points in the VC PMI. The analysis is based on different time frames, but we use the 15-minute bar to trade. The monthly average is $1,686, so the market trading above that average has activated a monthly bullish price momentum, with $1,797 as the first target. The annual data shows that the market is trading between the Sell 1 of $1,655 and the Sell 2 of $1,803. It is trading in a red zone on an annual basis. The annual target of $1,803, which almost matches the weekly target of $1,805, strongly indicates that the market is extremely overbought on a weekly and annual basis. It marks a harmonic relationship on the daily, weekly and monthly levels. It is likely that we are going to find resistance at those levels.
(Click on image to enlarge)
Strategy
This week we will watch the price action as it reaches $1,766, $1,776, and particularly $1,781 and $1,805, which are critical levels harmonically. If you are long as we enter this week, we highly recommend that you protect your positions if the market reaches those levels. Major short-term, intermediate targets will be completed.
Disclosure: I am/we are long DUST.
To learn more about how the VC PMI works and receive weekly reports on the E-mini, gold and silver, check us out on more


