
A global markets rebellion? Can it really happen, and how should citizens of the world prepare to handle it?
JP Morgan’s Jamie Dimon thinks it can happen. He gives America roughly the same decade of time that I’ve suggested the nation has…
Before global stock and bond markets tumble into the abyss in rebellious reaction to the US government’s debt addiction reaching “overdose” status.
(Click on image to enlarge)
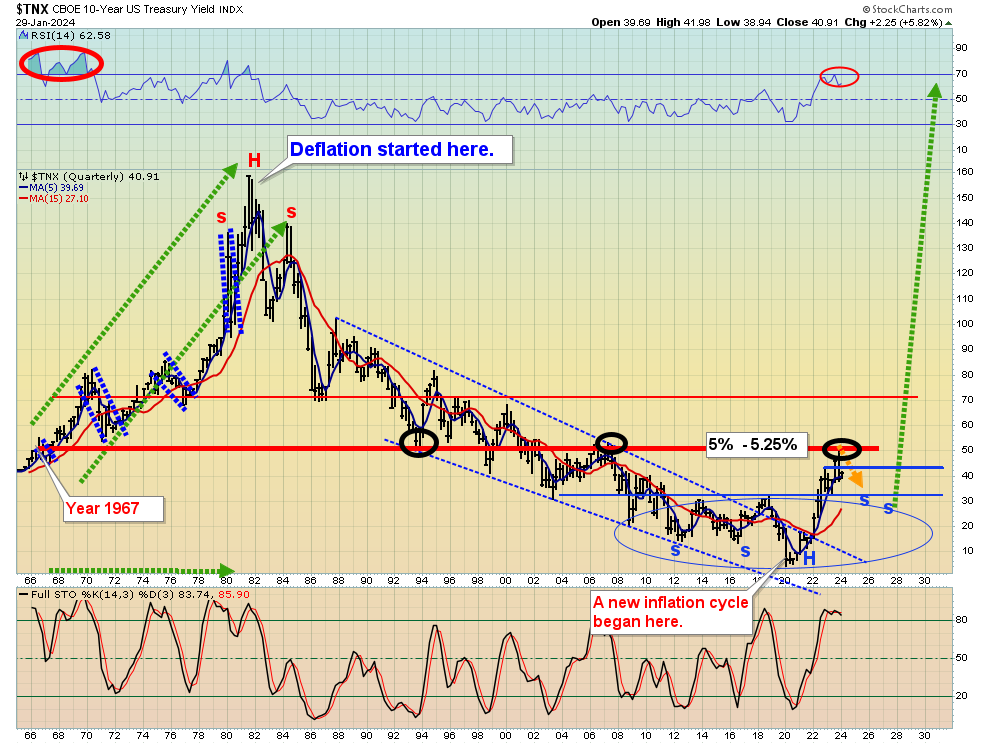
long-term US rates chart.
The inverse H&S action fits with Jamie’s scenario; bond market investors likely remain timid until around 2029.
From there? Well, from there out of control debt worship by the US government creates skyrocketing inflation, bond market terror, and when the 2030s begin… gold probably stages its next parabolic move higher, and does so as US stock and bond markets incinerate.
Why the year 2029? Well, one reason involves market cycles. Big market anniversaries and cycles need to be respected. October 2029 is the 100th anniversary of the epic 1929 US stock market crash!
Also, “Super Trumpy Man” (Donald Trump) is likely to be elected again this year. He’ll do many good things, but getting rid of vile US fiat and replacing it with gold is unlikely to be one of them.
He’ll drain the fiat swamp of some human swamp creatures, but unless he drains the fiat itself and replaces it with gold, not much can change with respect to the US government’s long-term debt obsession.
As Trump’s second term ends, a government debt fiend like Roosevelt probably gets elected in 2028… and eagerly announces dramatic debt expansion.
That would create a huge wave of “breaking point” fresh inflation. US stock/bond market investors would finally balk at the insanity… and sell those markets aggressively with no plans to rebuy them.
Unlike in the 1930s, the average American now owns no gold, so there’s none to confiscate. The bottom line: There won’t be any confiscation this time, but there will be a lot of mayhem. America is a horrifying debtor nation now… it’s basically the opposite entity of what it was in the 1920s.
The price of gold will go ballistic as the US government enters a de facto collapse state. That will create surreal amounts of new wealth for the gold-oriented citizens of China, India… and for savvy gold bugs in the West!
The road to the “Venezuelification of America” is a very real road, and to avoid becoming roadkill, gold bugs need only follow some very basic rules of the road.
On that note:
(Click on image to enlarge)
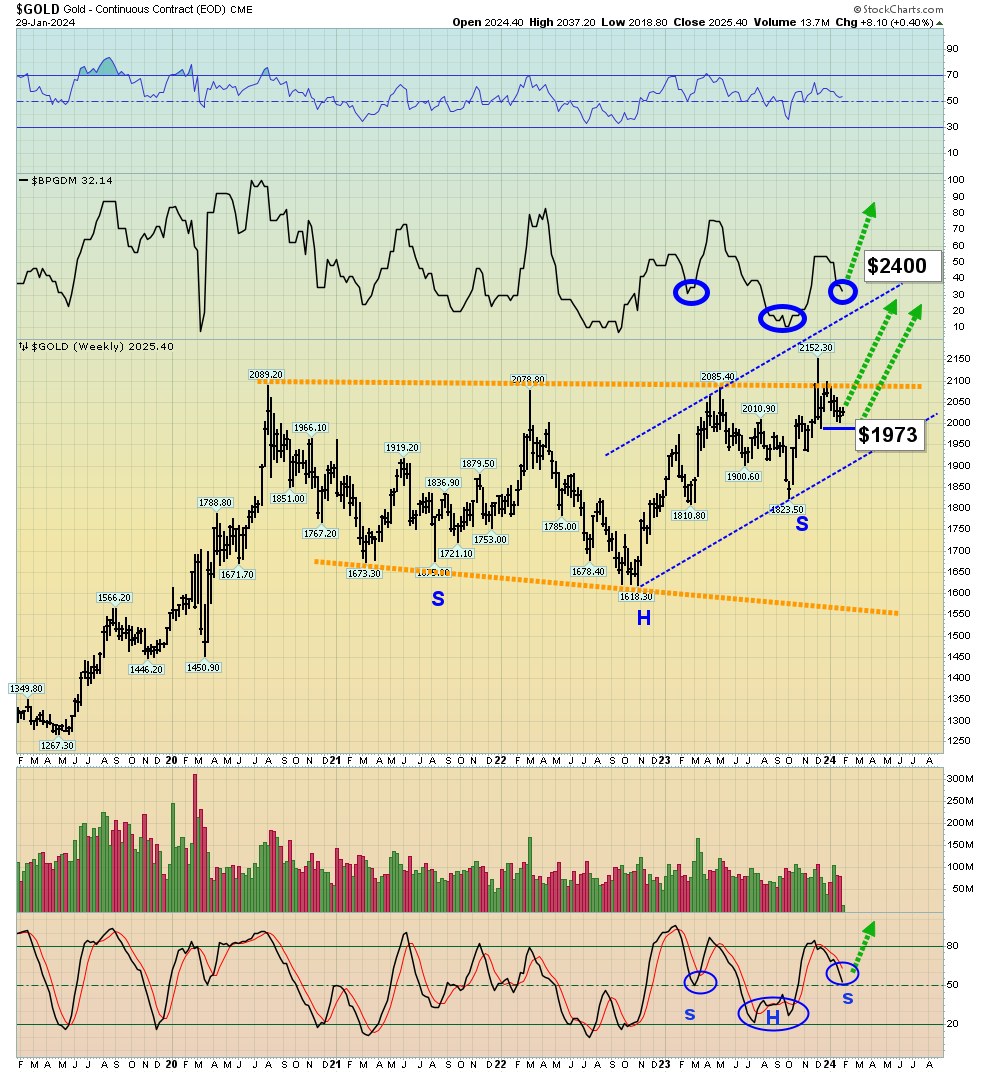
fantastic weekly gold chart.
There’s an inverse H&S bottom in play for the Stochastics oscillator (14,5,5 series), and H&S action is also apparent on the BPGDM gold stock sentiment index.
The BPGDM sits right above the 30 area, which is a major buy zone for the miners. I outlined the $2010 gold price as a key buying area for gamblers, and the trade looks great so far. For investors, $1973 (basis the cash price of gold) is the next big buy zone for the miners. Also, tomorrow’s FOMC meet and Friday’s jobs report could be the catalysts that launch gold’s next big rally, which may or may not begin from $1973.
To succeed in the gold market, gold stock and silver bullion investors simply need to wait for $100+/oz gold price sales that put the price near previous key highs or lows… and buy there and only there. It’s really that simple.
For a look at the daily gold chart:
(Click on image to enlarge)
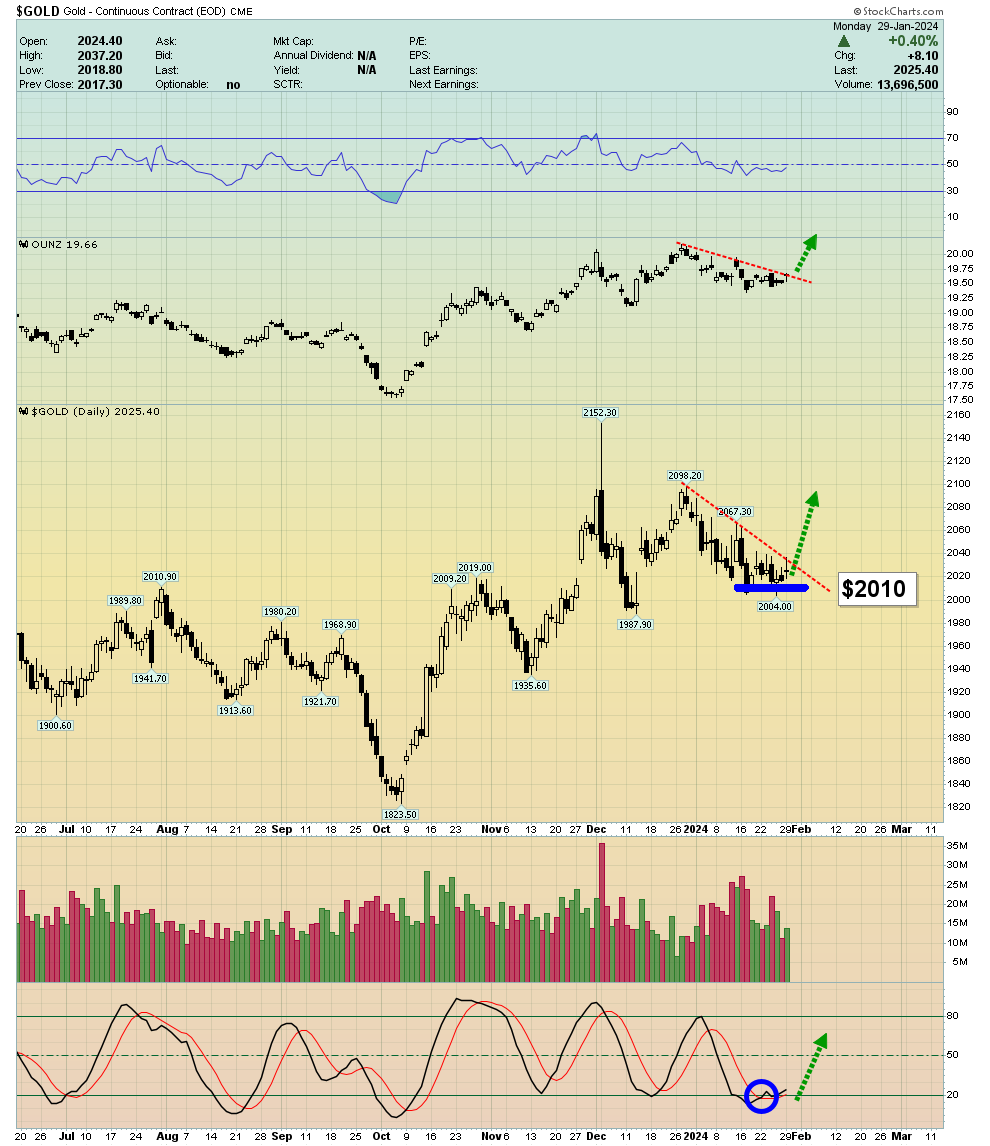
Stochastics is flashing a buy signal in the oversold zone and a move over the red dotted trendline would usher in significant hedge fund short covering and long position buying on the COMEX.
(Click on image to enlarge)
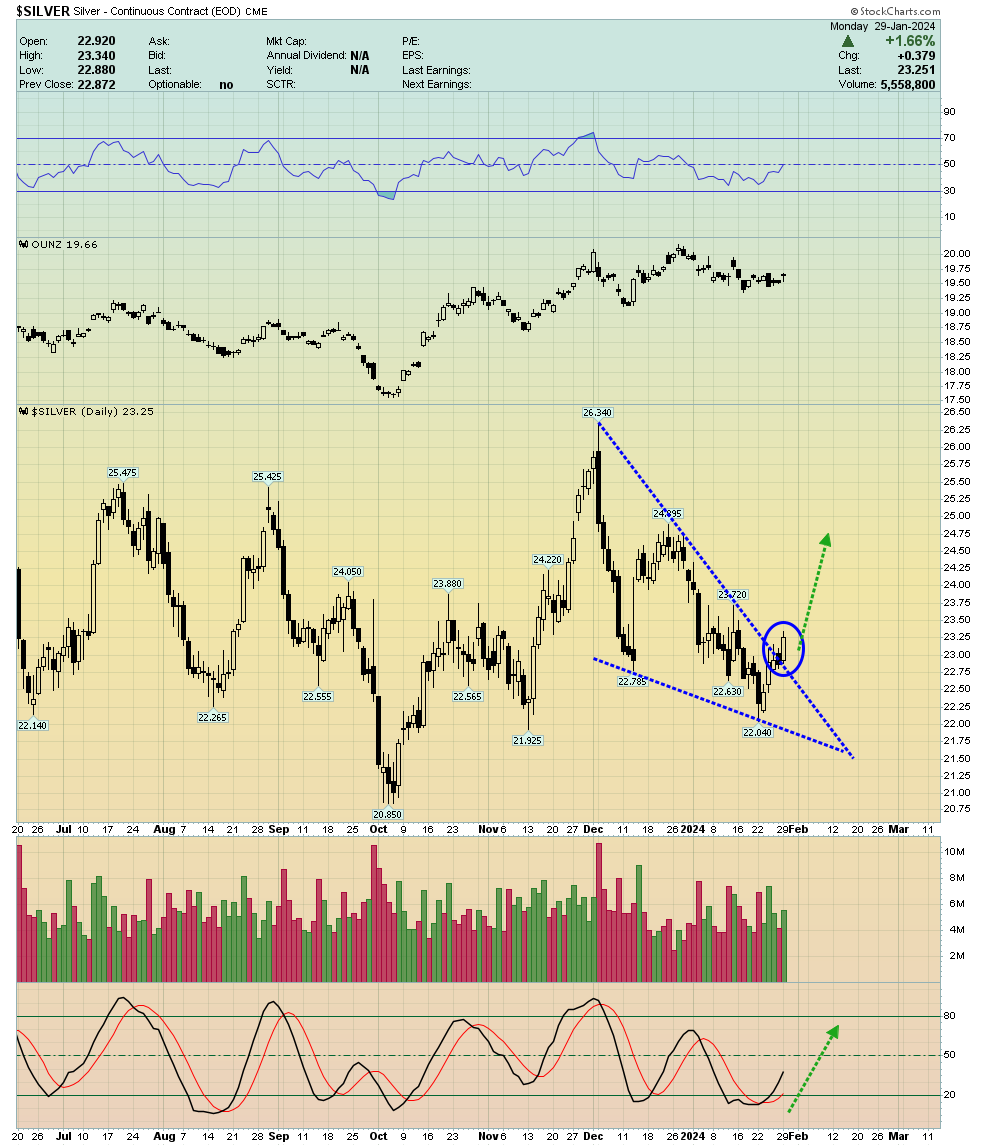
daily silver chart.
Interestingly, silver has already taken out its downtrend line as of yesterday and there’s some loose bull wedge action in play.
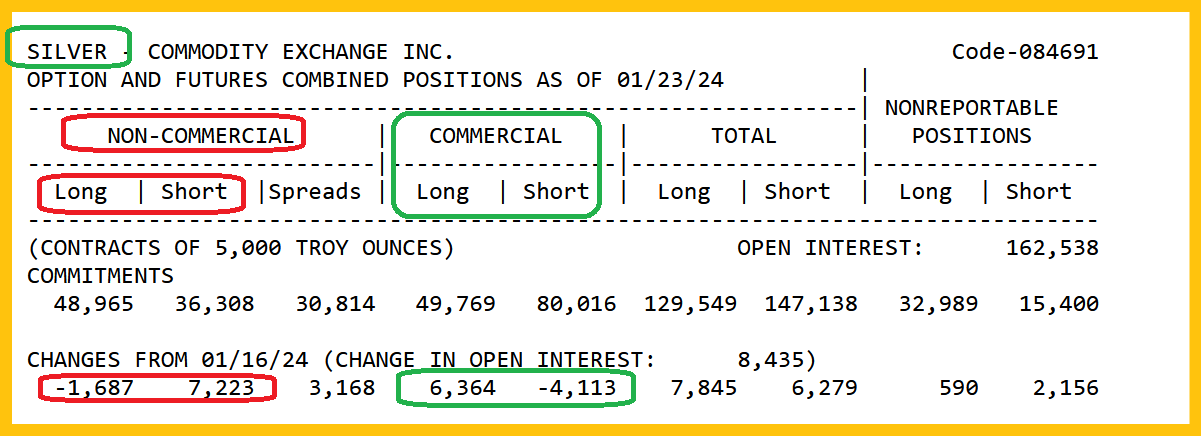
The COT report for silver is in sync with the technical breakout. The hedge funds are price chasers and the deep pocket commercials buy value. It’s likely that the funds are already booking losses on their short positions and any follow-through to yesterday’s breakout should see them load up on longs… and ignite the next big rally!
The COT report is a lagging indicator, but it’s a very good one.
For a look at the miners:
(Click on image to enlarge)
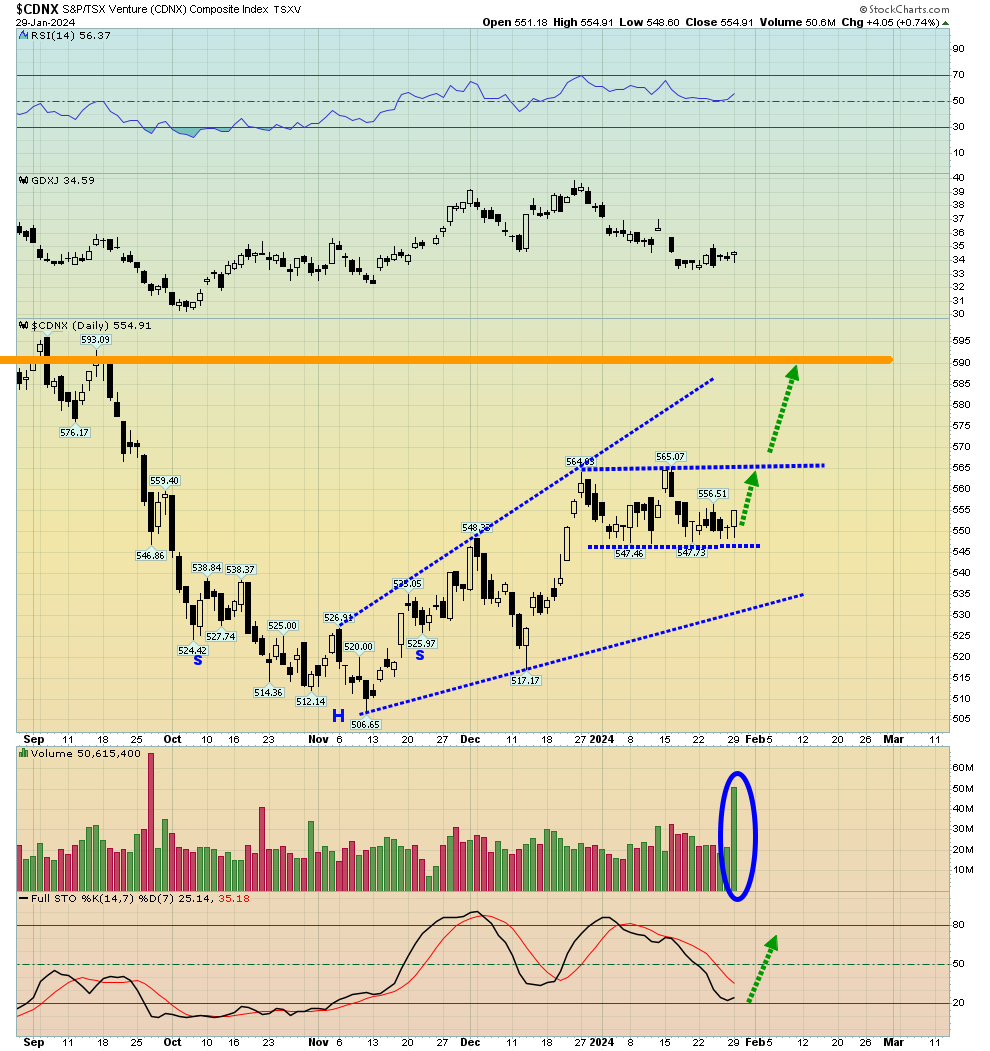
While silver staged a nice breakout yesterday, the day also featured the arrival of “game changer” volume for this important CDNX junior stocks index. Some gold bugs have no interest in the junior sector, but key action the CDNX often is often followed by similar action in the intermediates and seniors… so it’s important for all gold bugs to keep an eye on major junior index events. The volume here is significant!
(Click on image to enlarge)
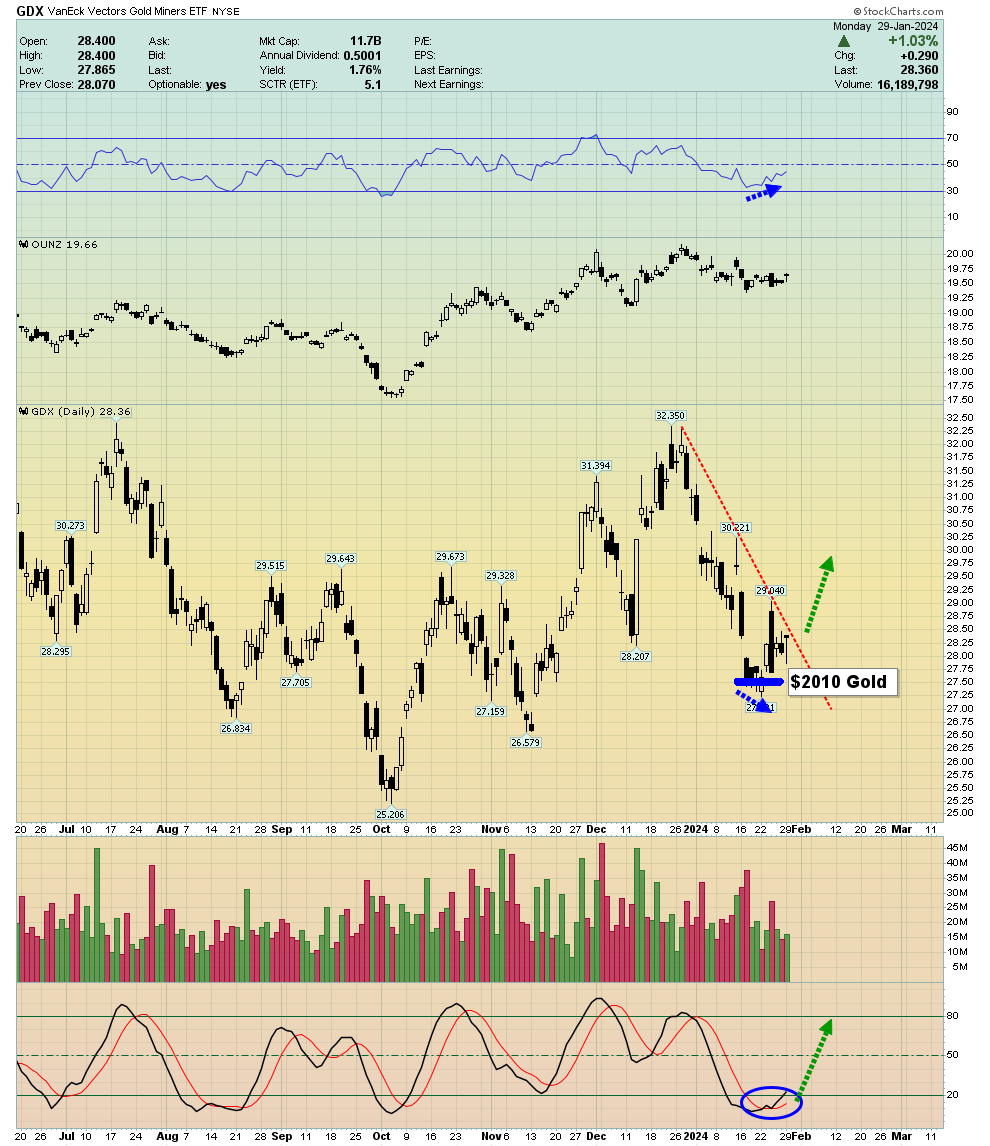
GDX daily chart.
GDX has a slight but bullish RSI non-confirmation with the price and there’s a budding Stochastics buy signal coming into play.
The FOMC announcement and jobs report could bring intense volatility. A double-bottom scenario at $27.25 for GDX (with gold approaching $1973) is possible, but unlikely. Regardless, after this week’s interest rate decision and employment statistics smoke clears, a major upside rally is the most likely order of business for gold, silver, and most miners too!
More By This Author:
Gold & Trump: A New Bull Cycle?Smile If You Love Gold
Tactics For A Golden Year


Comments
Log in or sign up to join the conversation.