
Gold (XAU/USD) pulls back to above $2,500 on Wednesday after touching a new all-time high of $2,531 on the previous day. The correction coincides with a slight bounce in the US Dollar (USD), to which Gold is negatively correlated.
The US Dollar Index (DXY) made a new year-to-date low of 101.31 early on Wednesday before rebounding to the 101.50s as the day progresses.
Gold impacted by interest rate expectations, outlook for US economy
Gold’s correction and the rebound in the US Dollar could be due to changing perceptions regarding the outlook for the US economy, which in turn impact the future course of interest rates in the country, a key driver of both assets.
Traders in interest rate futures are pricing in around a 30% chance the Federal Reserve (Fed) will cut interest rates by an unusually big 0.50% in September, whilst a regular 0.25% is now fully priced in.
Although this is lower than the 50% chances last week, the likelihood of a jumbo rate cut remains relatively high. The expectation of lower interest rates is positive for Gold as it lowers the opportunity cost of holding the non-interest paying asset.
The extent to which the market is pricing in Fed rate cuts has been criticized as reflective of an overly pessimistic outlook, according to some strategists – it supposes a hard landing for the US economy which is far from assured.
“Market pricing for Fed cuts is more consistent with a recessionary scenario than it is with normalization cuts,” says Daniel Ghali, Senior Commodity Strategist TD Securities.
Data out on Wednesday could impact expectations with the publication of the US Quarterly Census of Employment and Wages (QCEW) for March. The census data is used as a benchmark to assess the Nonfarm Payrolls (NFP) report. If it differs markedly – as it has in the past – it may lead to revisions in NFPs. Although the data will only cover the period to March 2024, avoiding the July number which caused the upset in early August, a big downward revision could still revive fears that the US economy is heading for a hard landing, with upside implications for Gold.
Gold is overbought – TD Securities
Gold futures and options market positioning data shows the market is extremely overbought, which may limit the precious metal’s upside potential, according to Ghali.
“With macro fund positioning in Gold already consistent with 370 bps of cuts, forward returns will be weighed down by frothy positioning. Macro fund positioning has scarcely been higher than it is today, whereas in this scenario, Shanghai trader positioning has also reverted towards record highs, and CTAs are also holding onto their 'max long',” adds the strategists.
On the other side of the trade, China demand remains strong, according to Jim Wyckoff of Kitco News, who cites a note from broker SP Angel that continues highlighting robust demand from the Chinese market.
“Broker SP Angel said this morning in an email dispatch: ‘Chinese exporters and traders have been seen rushing to buy Yuan and probably Gold in anticipation of further US Dollar weakness. The metal has also been buoyed by Chinese buying after China’s central bank cracked down on local government bond buying. Troubles in the Chinese property sector have caused Gold to become a preferred instrument for individual savings in China,’” said Wyckoff.
Gold may also continue seeing inflows as a safe-haven with the news that US Secretary of State Antony Blinken has returned home without successfully brokering a Middle East peace deal. An Iranian all-out attack against Israel also remains a background risk factor.
Technical Analysis: Gold stalls in uptrend
Gold (XAU/USD) pulls back after extending to new all-time highs. That said, it is in a short-term uptrend and given “the trend is your friend” is likely to continue rising eventually.
On August 16, Gold decisively broke out of a range it had been stuck in since July. The breakout generated an upside target at roughly $2,550, calculated using the usual method of taking the 0.618 Fibonacci ratio of the range’s height and extrapolating it higher. The target is a minimum expectation based on technical analysis.
XAU/USD 4-hour Chart
(Click on image to enlarge)
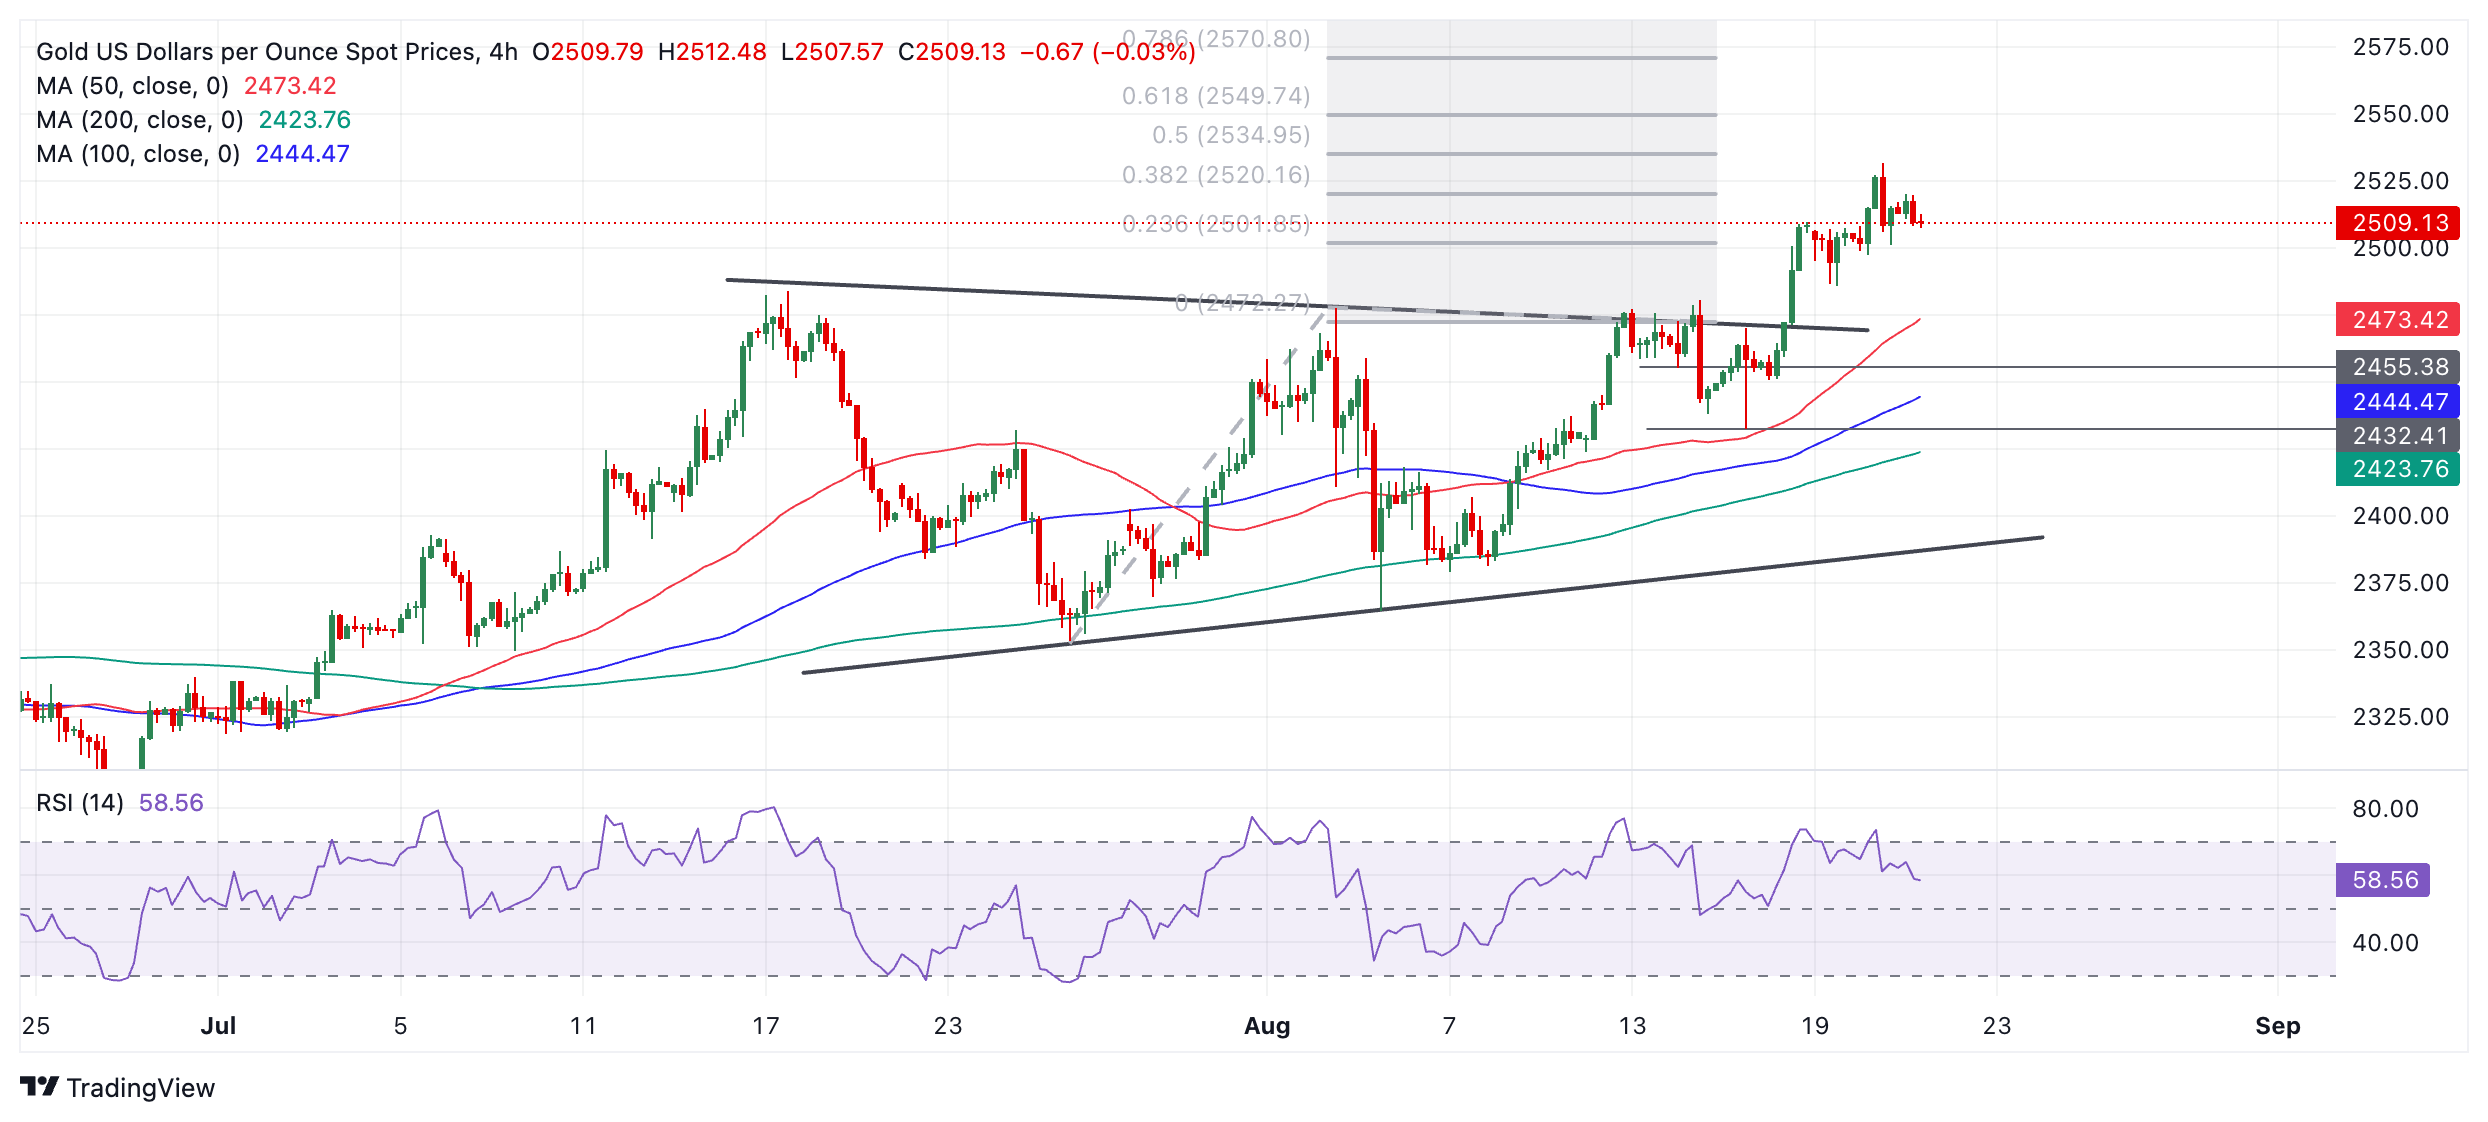
The Relative Strength Index (RSI) has just exited overbought territory, providing a sell signal as Gold is pulling back. This corroborates the correction but does not give any clues as to how far it will extend. It is possible it could find support at $2,500. A deeper correction could fall all the way to the top of the range at circa $2,475.
Gold is in a broad uptrend on a medium and long-term time frames, however, which further supports an overall bullish outlook for the precious metal.
More By This Author:
XAG/USD Bulls Might Await Sustained Move Beyond $30.00 MarkNZD/JPY Price Analysis: Bearish Bias Prevails As Technical Indicators Remain Flat
AUD/JPY Price Prediction: Consolidates Near Monthly Top, 100.00 Confluence Holds The Key For Bulls


Comments
Log in or sign up to join the conversation.