
Gold Consolidation: Silver Takes Center Stage
Gold didn’t do much yesterday, but there was more than one thing happening that served as an additional bearish confirmation. The most important sign came from silver’s short-term outperformance.
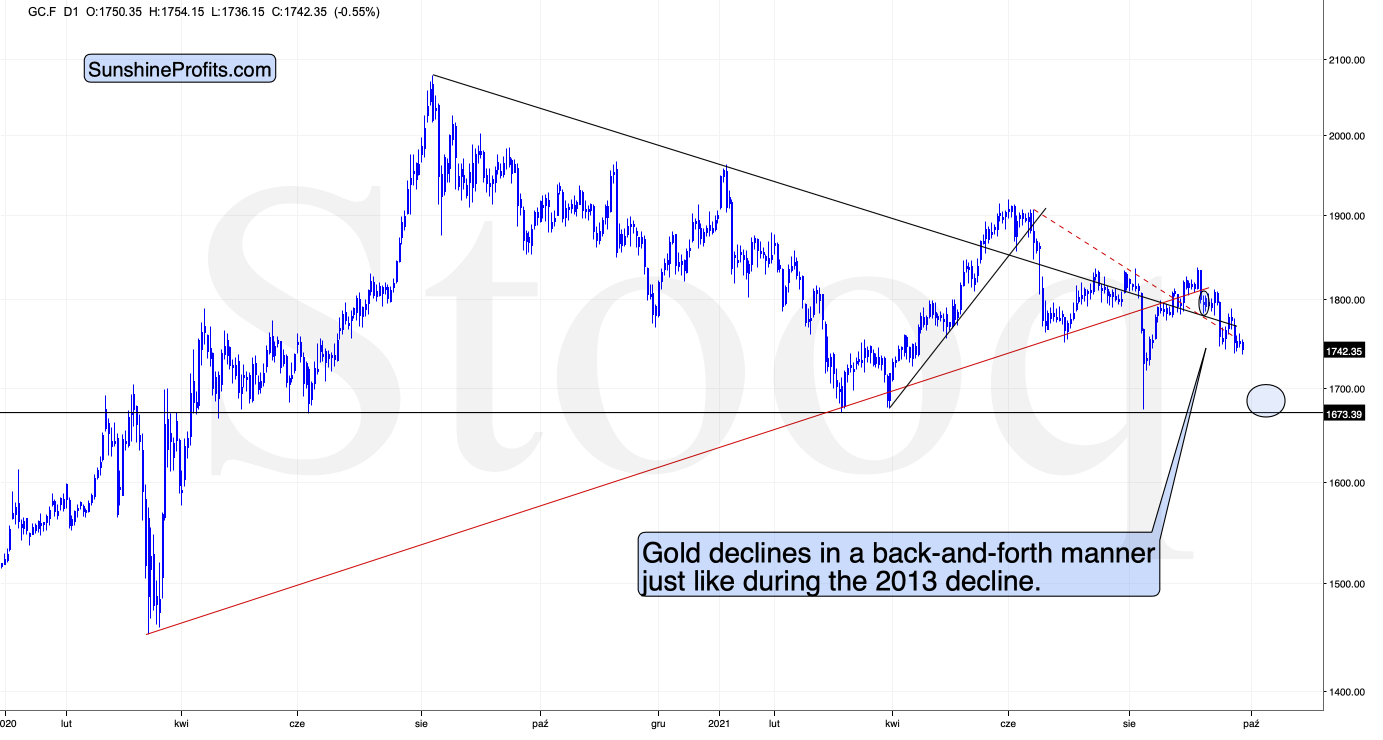
As you can see on the above chart, gold formed a bearish reversal candlestick yesterday, and it moved lower in today’s pre-market trading. Since it has just moved to a new monthly low, it could be the case that yet another small corrective upswing is already over.
“Yet another,” as gold has been declining in a back-and-forth manner for a few weeks now. As I explained yesterday and in the previous weeks, this makes the current situation similar to what we saw previously – in 2013.
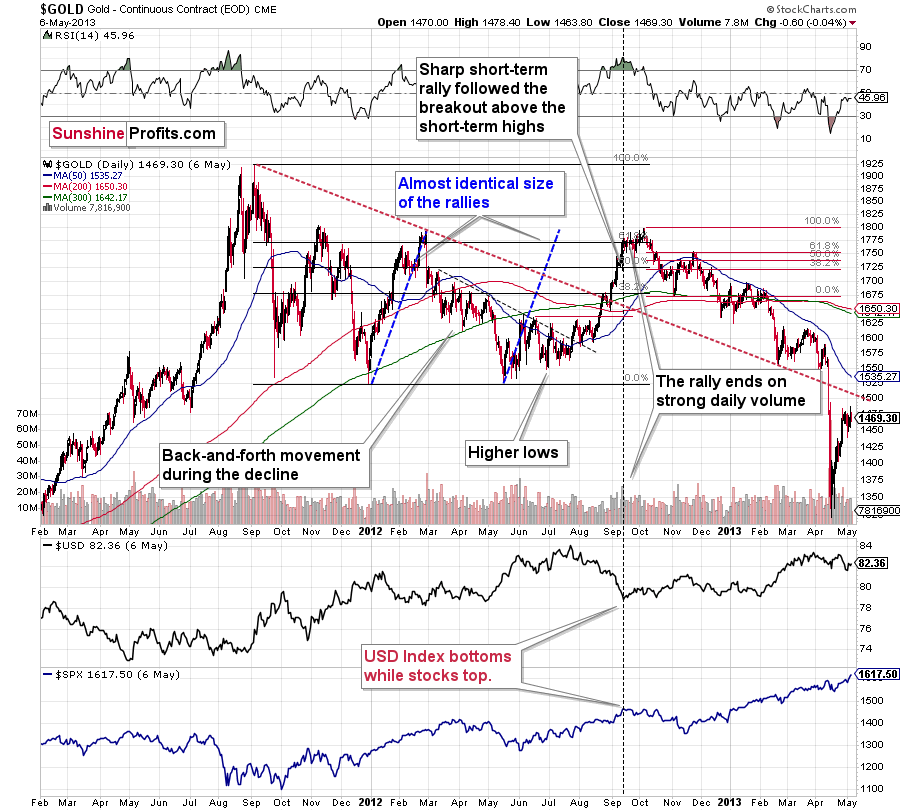
Between September 2012 and February 2013, gold declined in a back-and-forth manner as well, and the current situation seems to be analogous to what we saw in February 2013. At the time, the final short-term upswing took gold to its 50-day moving average (marked with blue), and we saw something very similar recently. The recent high ($1788.40) was very close to gold’s 50-day moving average too – less than $10 from it.
Silver in the Spotlight
However, as I wrote at the beginning of today’s analysis, the key bearish sign of yesterday’s session came from silver.
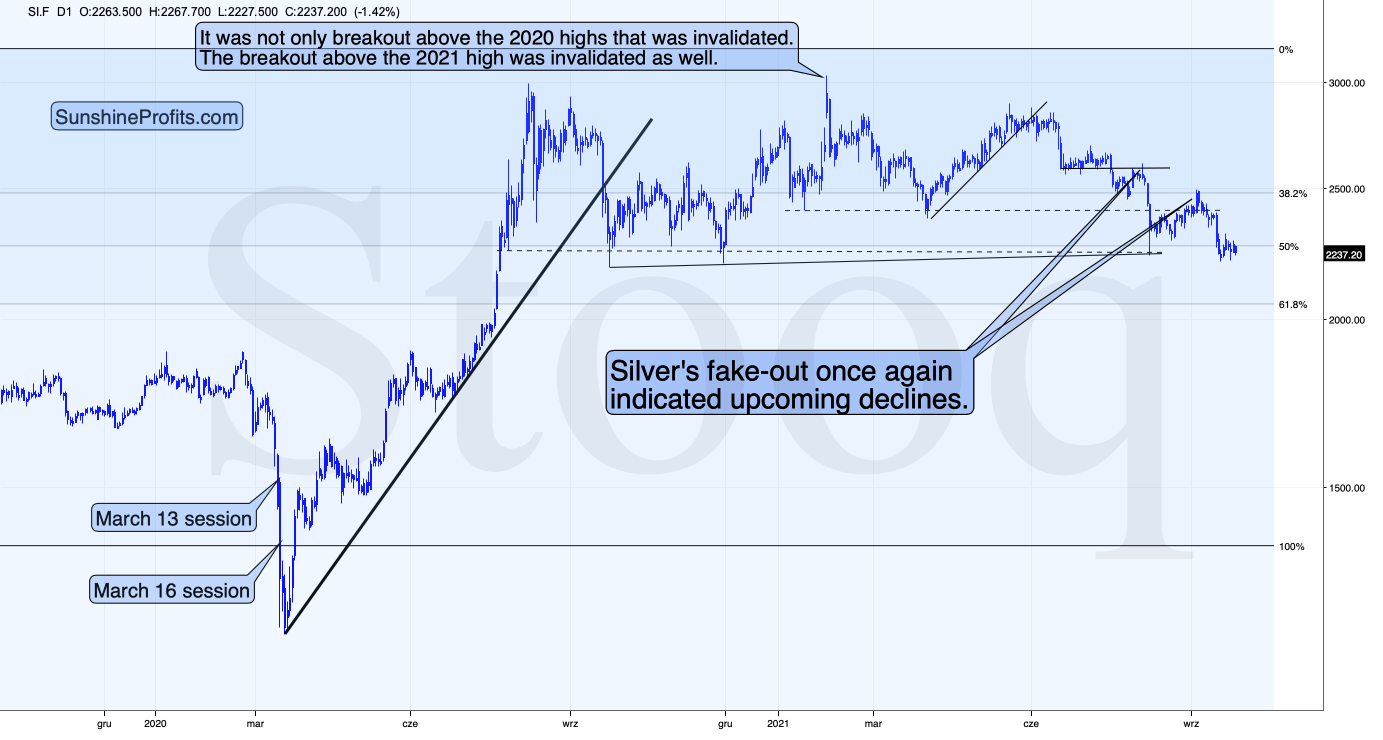
While gold ended yesterday’s session only 0.02% higher, silver ended it 1.20% higher. This means that silver outperformed gold yesterday. Silver’s short-term outperformance of gold is bearish, especially when it’s accompanied by mining stocks’ weakness relative to gold.
While miners didn’t underperform gold yesterday, they did so on Friday. Thus, it’s fair to say that we saw a mix of those two important signs, and they together paint a bearish picture for the short run.
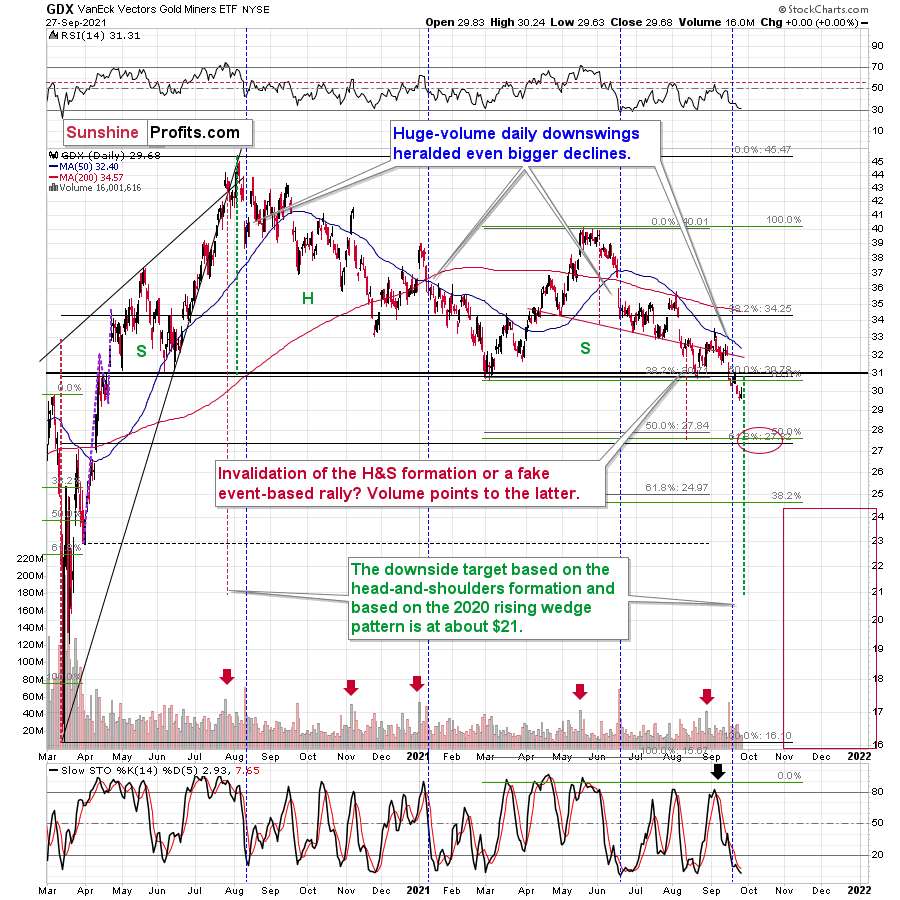
Despite the intraday rally, the GDX ETF ended yesterday’s session completely unchanged.
And while gold and silver moved slightly higher, GDX did nothing, and the GDXJ ETF underperformed, just as it was likely to.
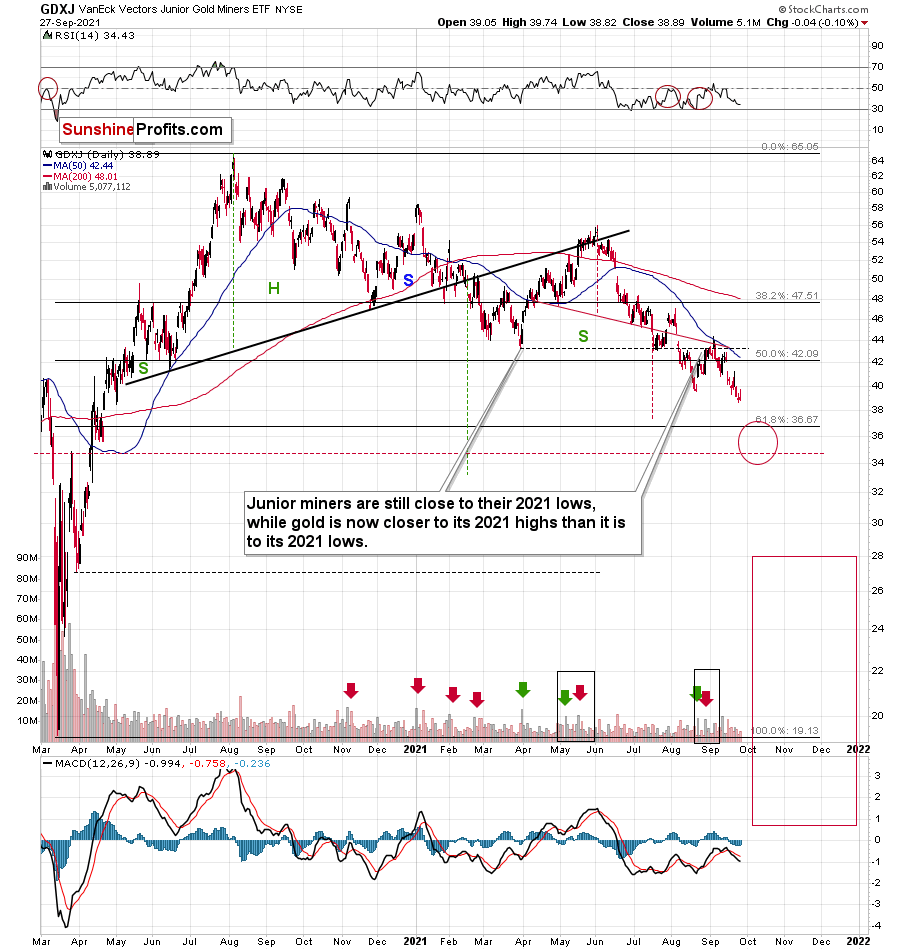
The GDXJ declined by 0.1%. This may not be a lot, but the GDXJ was once again one of the weakest parts of the precious metals sector, which bodes well for our profitable short positions in the junior miners. The fact that this was the lowest close that we saw so far (!) this year adds to the bearish implications.
The USD Index
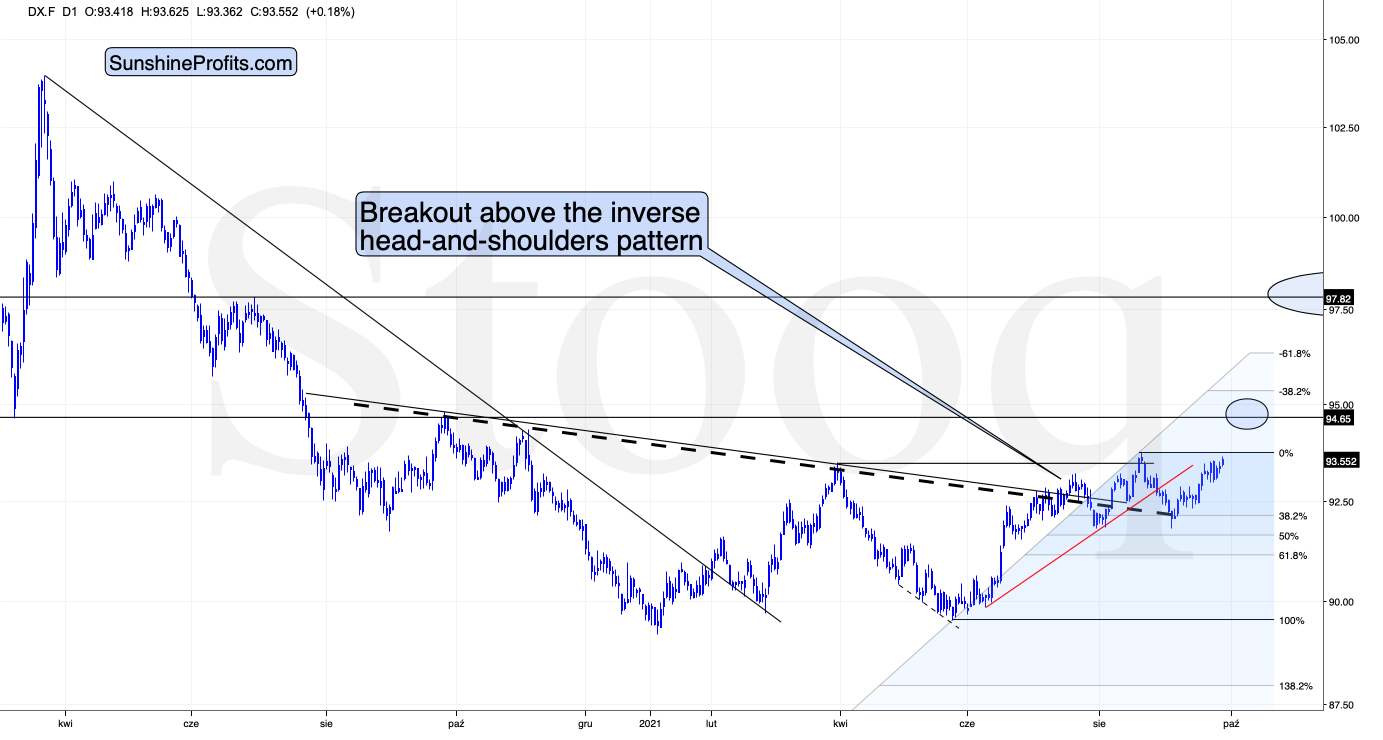
So far, the USD Index is just a bit higher in today’s pre-market trading, but it seems that the next big run-up is at hand.
Why? Because the USDX has been consolidating above the inverse head and shoulders pattern breakout for a long time, and it’s relatively uncommon for the consolidations to take this long — let alone even longer.
And as the USD Index rallies, gold, silver, and mining stocks are likely to decline. Since they are weak even without USD’s help, the upcoming decline in the PMs and miners is likely to be profound.
Disclaimer: All essays, research and information found on the Website represent the analyses and opinions of Mr. Radomski and Sunshine Profits' associates only. As such, it may prove wrong ...
more

