
Gold Charts: A Bullish Shine
Meddling in faraway lands is the hallmark of late-stage empires, and of bullies.
When former US Secretary of State John Kerry bragged that 30% of his allies in Syria were terrorists, his president Barrack Obama eagerly borrowed more fiat and used it for more meddling. The macabre goal of the meddling is perhaps best described as the complete “madmaxification” of the Syrian state.
Incredibly, the American government continues to gleefully borrow fiat and use it to pound mangled Syrian citizens with a vast array of destructive sanctions.
Late-stage empire meddling gone wrong is good for gold, and after wrecking Iraq, Syria, and Libya (and attempting to wreck Egypt), US “Gmen” now appear to be trying to wreck Taiwan and Ukraine… all as part of a “super size” scheme to ruin the governments and citizens of China and Russia.
This is spectacular news for gold and horrific news for billions of citizens around the world.

Conspiracy buffs will note that just 24 hours after the Turk government railed against the insanity of the US government’s proxy war against Russia, Turk citizens were killed and maimed in a terrorist attack.
This comes not long after another attack blew up the Nord Stream pipelines. While the US government can claim it’s not directly involved in either act, its “allies” like Turkey (Nations and citizens bullied and bribed into following US government orders?) are becoming increasingly agitated with the “my way or the highway” approach taken by US bullies. Is there any good news?
Well, the good news is that the weekly gold chart perfectly encapsulates all the horrifying fundamental actions of this 2021-2025 war cycle.
(Click on image to enlarge)

A fabulous bull wedge (with a massive breakout) is in play.
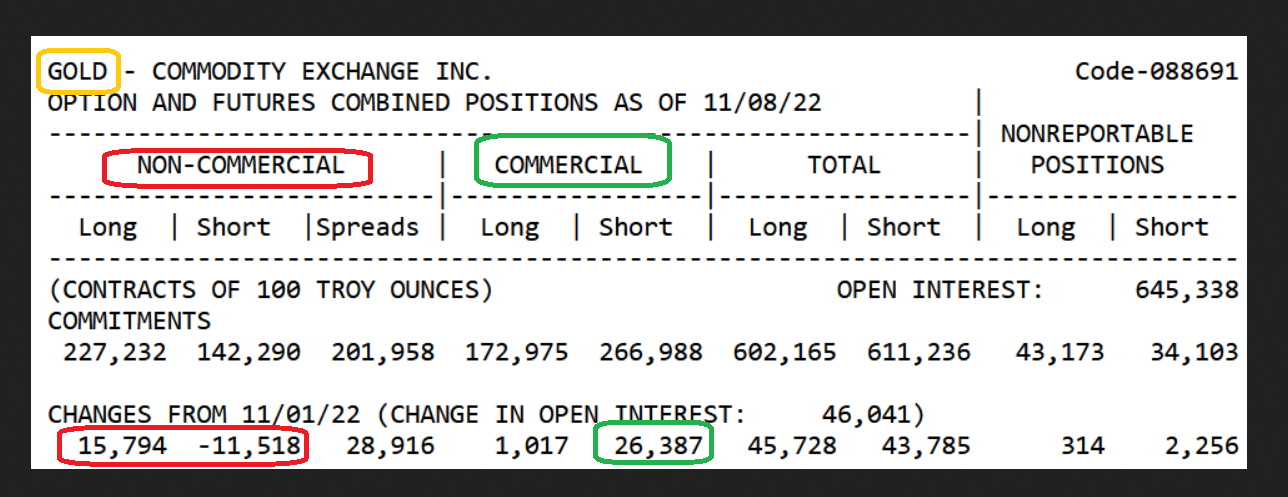
The smart money commercial traders have been adding COMEX short positions into the rally, while the dumb money funds have bailed on shorts and added longs.
This suggests a pullback may be imminent, and it would make this chart even more bullish than it is now because it would create the right shoulder of an inverse H&S pattern.
(Click on image to enlarge)

For an even more bullish scenario:
(Click on image to enlarge)
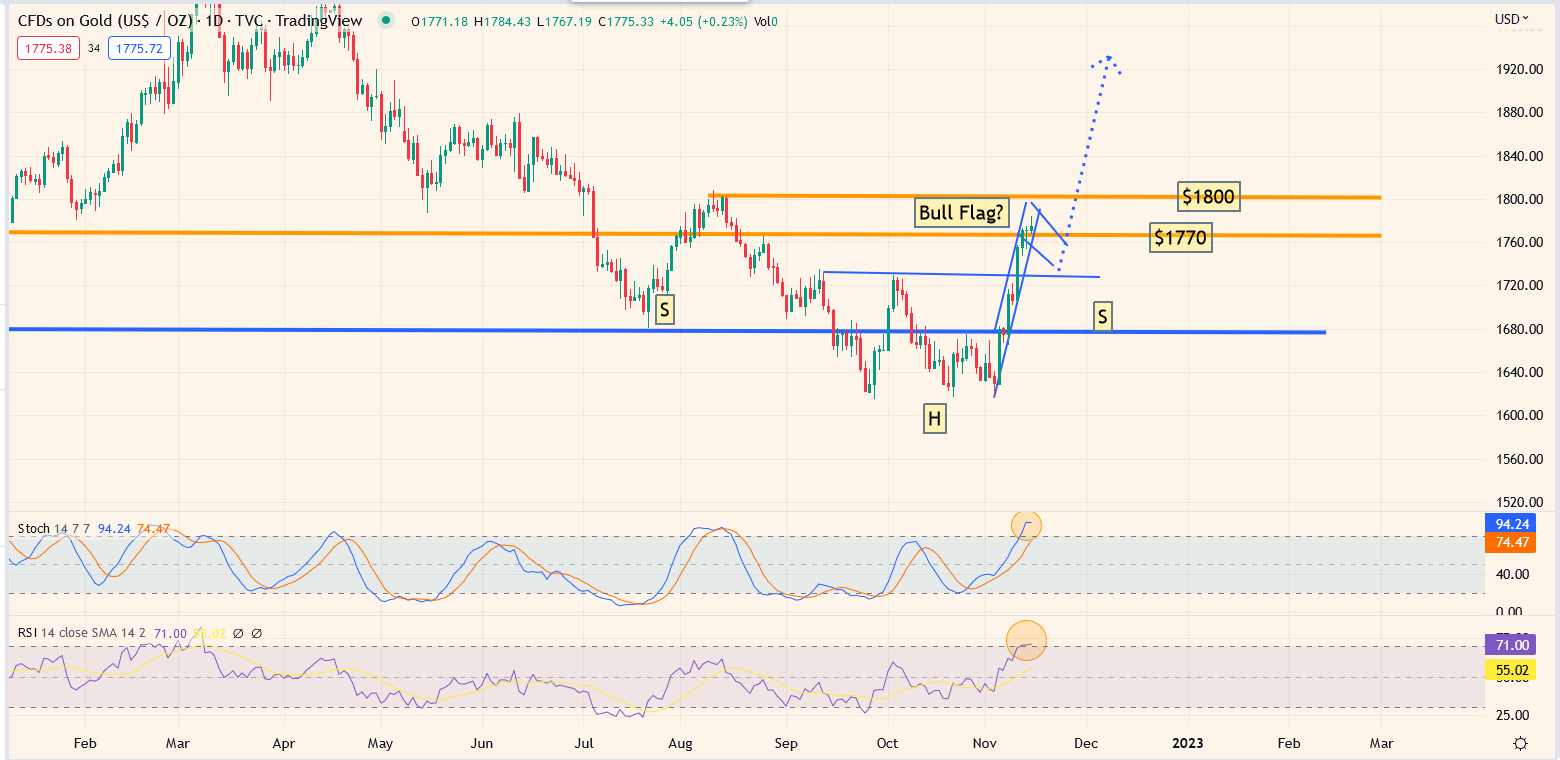
The pullback could take the form of a bull flag, which would be followed by another vertical blast higher.
Clearly, all technical traffic lights for gold are green!
Bungled wars and bullying are creating inflation around the world. There’s also a new tailwind for gold, which is a possible recession that sees the Fed fade its rate hikes while inflation gets stuck in the 5% zone.
(Click on image to enlarge)

short-term oil chart.
The H&S top is likely created by sinking demand in the West. A potential fade in Chinese lockdowns is not helping the price.
This is a time to book some profits on bond market short positions and focus on gold, silver, and the miners.
What about the US stock market? Is a change in Fed policy and a dip in the price of oil a major buy signal for the stock market?
I would suggest it’s a better time to buy put options than new positions.
(Click on image to enlarge)
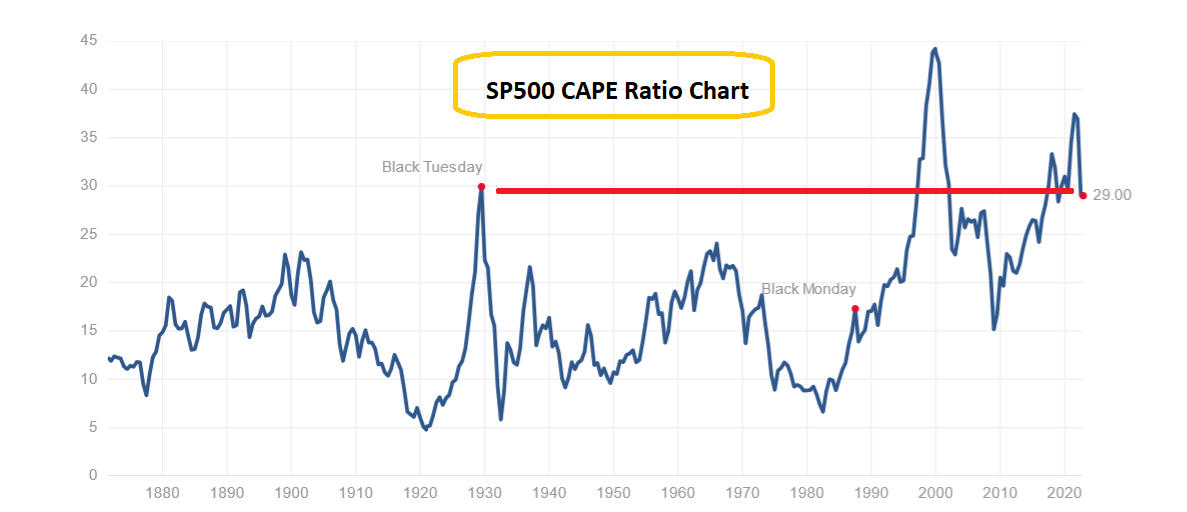
Stock market investors believe buying stocks at valuation levels seen at the highs of 1929 is a great idea, simply because the Fed is creating a recession.
They believe the Fed will open the soup kitchen doors (rate cuts and QE), and the stock market will soar as it did from 2008 to 2021.
That’s unlikely. QE and rate cuts to zero are reserved for extreme situations. What’s more likely is that inflation sticks around 4%-5%, the Fed stops hiking in the spring of 2023 but doesn’t cut, and continues QT.
That means stagflation becomes the major theme… which means gold and silver miners become the biggest theme of all!
On that keynote:
(Click on image to enlarge)
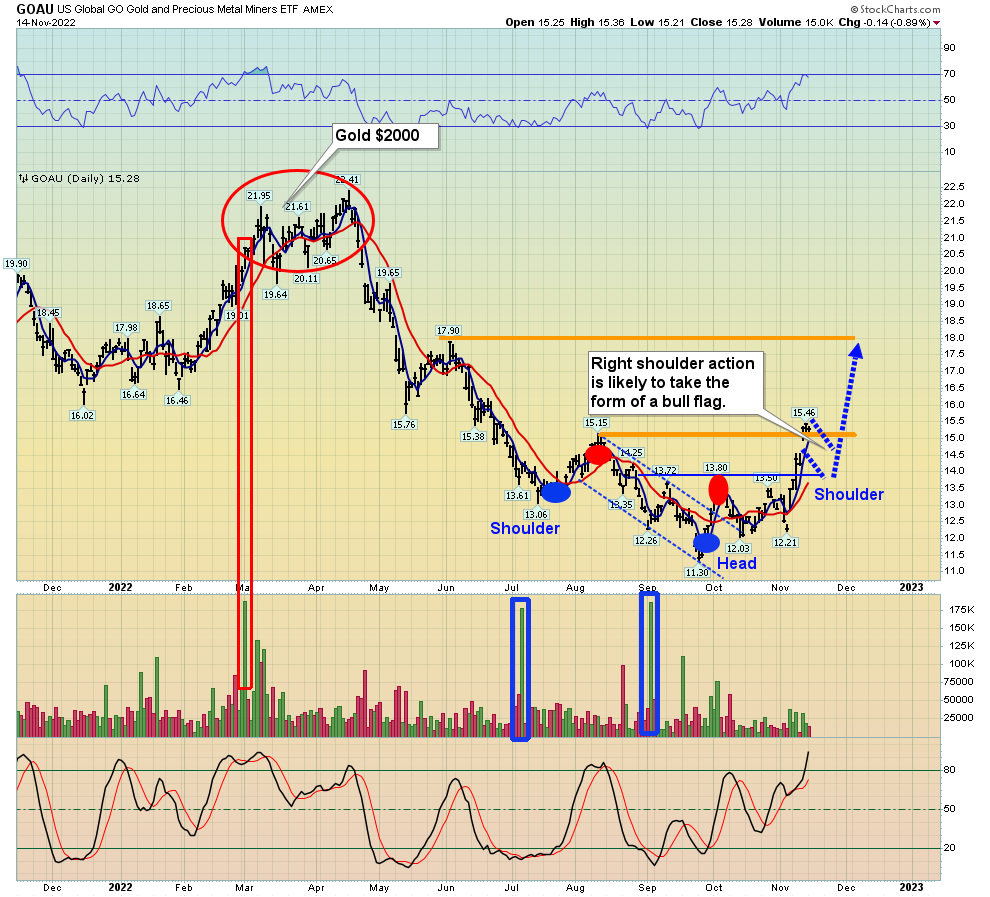
GOAU daily chart.
I’ve suggested that in hindsight, the year 2023 will be looked at as the start of a multi-decade “Grand Stagflation” era.
The base pattern on GOAU and on a myriad of individual miners (junior, intermediate, and senior) suggests that the launch could begin in January, but if the right shoulder plays out as a bull flag, it could happen this month. With all due respect to US stock market investors, CAPE ratio 29 may be best suited for price-chasing swine, while the valuation and technical action on the miners looks quite fine. Enjoy!
More By This Author:
The U.S. Election And A Vote For GoldThe US Election & A Vote For Gold
Gold: Strong In November?


