

Image Source: Pixabay
Gold prices are gaining traction as global uncertainty drives investors toward safe-haven assets. Ongoing US-China trade tensions, geopolitical instability, and fiscal concerns in the US are fueling demand. Despite short-term pullbacks, buyers remain active. Technical charts also point to strong momentum. Together, these factors are shaping a bullish outlook for gold in the near and long term.
Gold Prices Rise amid US-China Trade Uncertainty and Geopolitical Risks
US-China trade tensions remain unresolved despite a recent phone call between President Trump and President Xi, which was described as positive. While the market initially reacted with optimism, the relief was short-lived. Trump’s unpredictable and shifting stance on trade negotiations continues to inject uncertainty into investor sentiment, leading to cautious positioning in the gold market.
Meanwhile, geopolitical risks persist worldwide. The ongoing conflict between Russia and Ukraine, along with heightened instability in the Middle East, continues to drive demand for safe-haven assets, such as gold. These enduring threats show no signs of easing and remain a key factor supporting the precious metal’s appeal during uncertain times.
The US fiscal picture also adds to the bullish case for gold. Rising national debt and fears over long-term budget sustainability are eroding investor confidence in the US Dollar. Simultaneously, signs of a cooling labor market—despite last month’s strong jobs report—have raised expectations for two potential rate cuts from the Federal Reserve by year-end. However, mixed messaging from Fed officials has created confusion. With policymakers taking a cautious approach, investors are closely watching for clearer signals on the Federal Reserve’s next move. A disappointing jobs print could increase expectations of Fed easing and further lift gold prices.
Gold Price Breaks Technical Resistance after 4-Year Parabolic Base
The chart below shows the price movement of gold in USD over time, from mid-2018 to mid-2025. The chart identifies a significant technical pattern known as a "parabolic base." From 2020 to mid-2023, gold prices formed a rounded bottom, creating a strong support zone. This base took around four years to develop, suggesting a long accumulation phase.
(Click on image to enlarge)
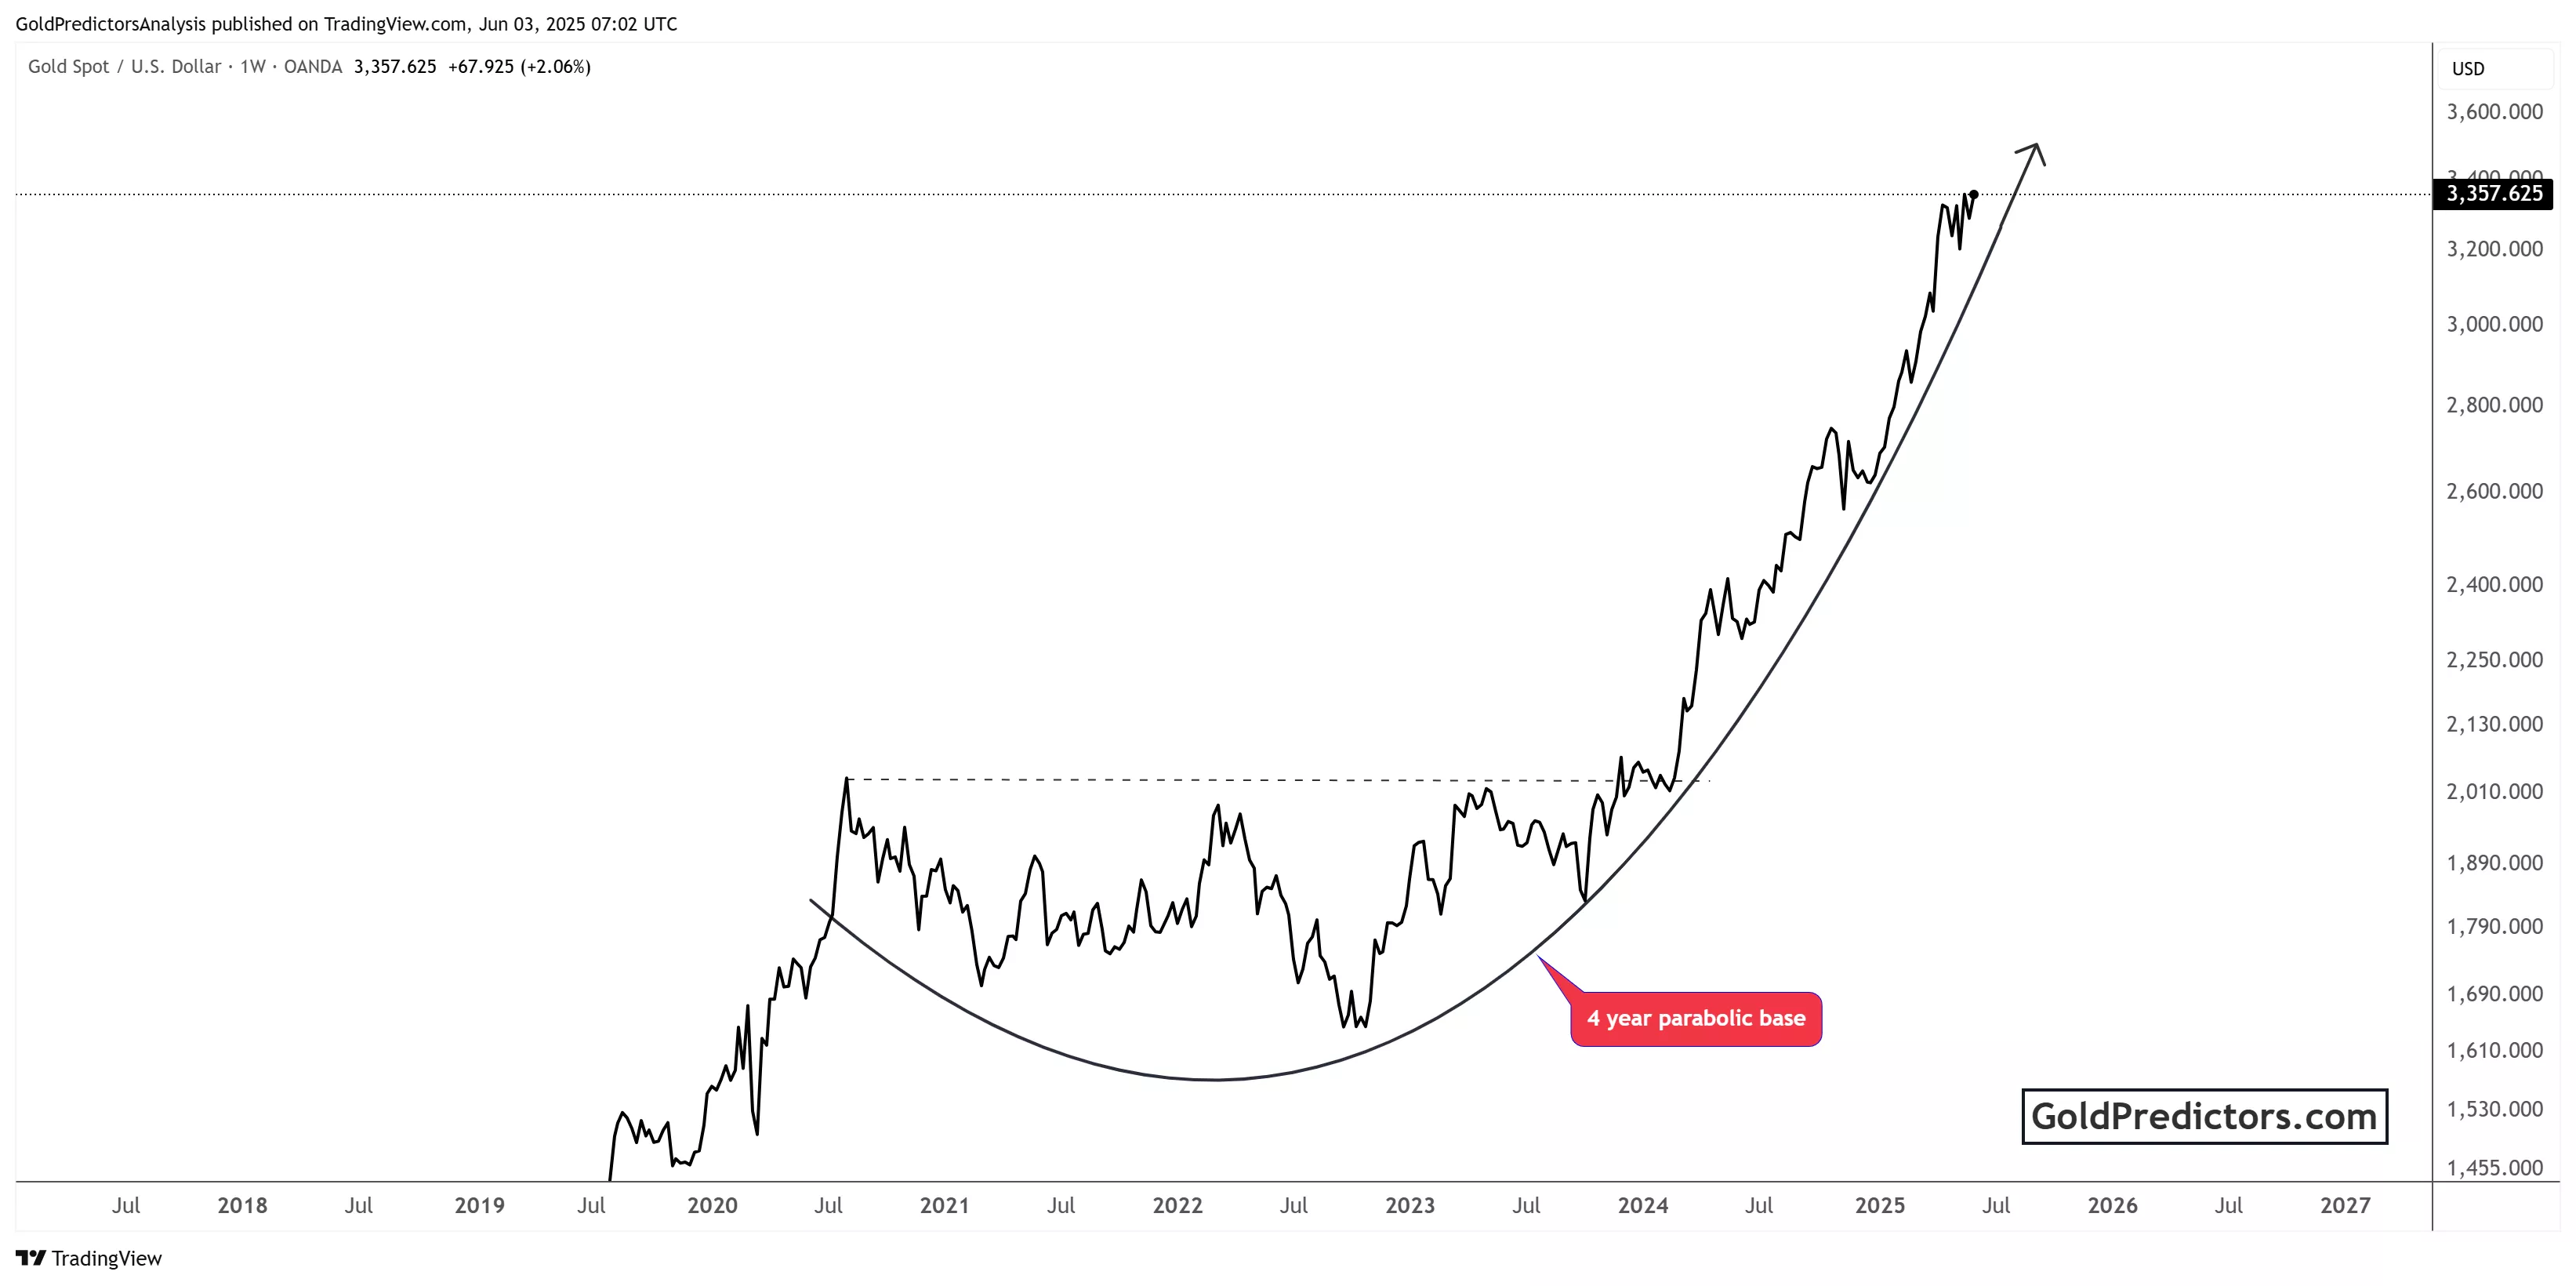
After mid-2023, the price broke out of this base and entered a strong upward trend. The curved line represents the parabolic rise that followed the breakout. Gold prices climbed rapidly, breaking past resistance levels with increasing momentum. By June 2025, the price reached over $3,350 per ounce, showing a gain of over 2% in just one week.
The arrow at the top right suggests continued bullish momentum. The parabolic shape implies accelerating buying interest. This pattern often signals a powerful uptrend but can also warn of future volatility. Traders may see this as confirmation of a strong bull market for gold.
Conclusion
Gold remains well-positioned for further gains. Strong fundamentals and a clearly defined parabolic breakout support continued upside. Investors are watching key economic data and Fed signals, but technical strength keeps the bullish case intact. Unless fundamentals shift sharply, gold is likely to stay on its upward path. Any dip could present a fresh buying opportunity for long-term bulls.
More By This Author:
Gold Surges On Weak U.S. Data, Fiscal Worries, And Bullish Breakouts
Gold Remains Resilient As Traders Monitor U.S.-China Trade Talks And Fed Signals
Gold Price Holds Above Key Support Despite Dollar Strength And Policy Uncertainty


Comments
Log in or sign up to join the conversation.