
Image Source: Unsplash
Aside from gold’s long-term value as an enduring and sound financial asset, many people take interest in the shorter-term aspects of owning the monetary metal and its monetary/commodity sidekick, silver. Today we update the weekly chart technical status of both metals.
In future articles, we’ll cover the Commitments of Traders for gold and silver. These are important risk/reward gauges from a sentiment standpoint at any given time. * We will also continue to update the technicals on different time frames and the all-important macro fundamentals.
Gold’s weekly chart shows the metal having recovered from a false breakdown and shakeout near the end of 2022 with a neck-snapping reversal upward thereafter. If nothing else, this instructs why it is reasonable for investors to hold gold for its long-term value and not worry about the short-term swings that traders deal with.
Fast forward to today, we find the metal on the verge of a breakout to all-time highs (2089.20 is the marker). This is gold’s third approach of that level, including the 2020 upside blow off. That was a manic situation as emotional market participants knee-jerked into the metal, sending it into a well-deserved and volatile two-year consolidation/correction.
As to the current blue sky attempt, gold is moderately overbought by weekly RSI to a degree that halted the last two rallies. So some volatility can be expected now that it has taken out – at least temporarily – the 2000 ’round number’ that has been making headlines. Short-term volatility aside, this is a bullish picture and the old TA saying is that the more times resistance is tested the weaker it becomes. This is test #3 and a breakout is also possible before the next correction.
(Click on image to enlarge)
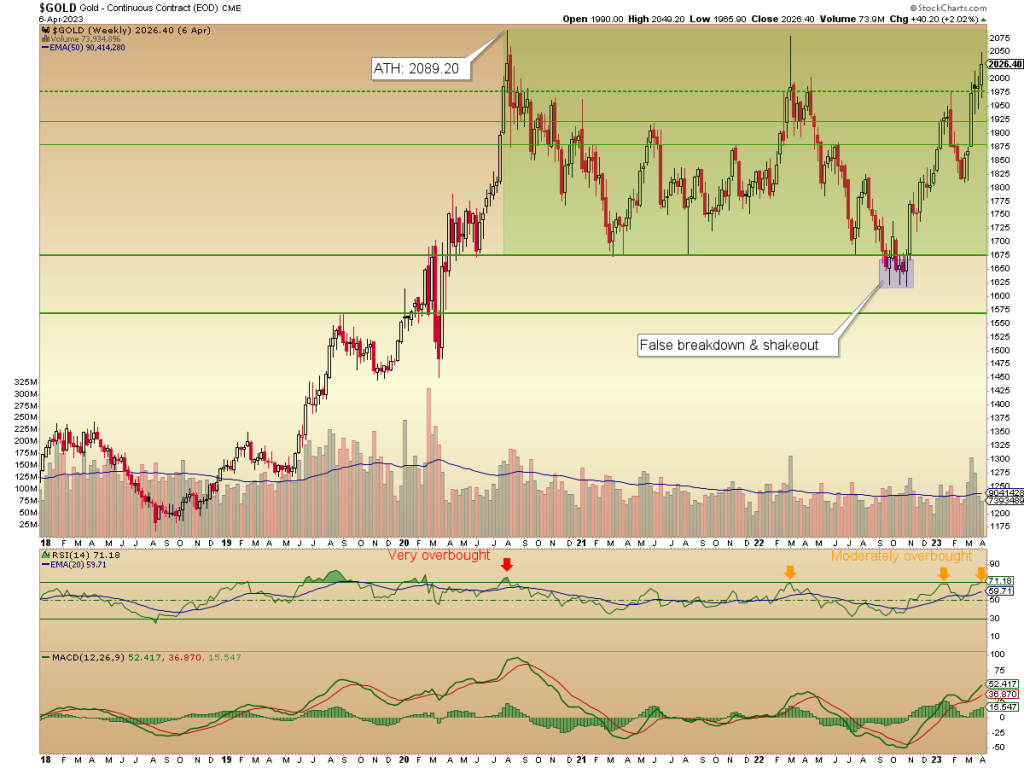
As a side note, the longer-term measured target for gold is 3000+, which if it plays out could come within the next year or two.
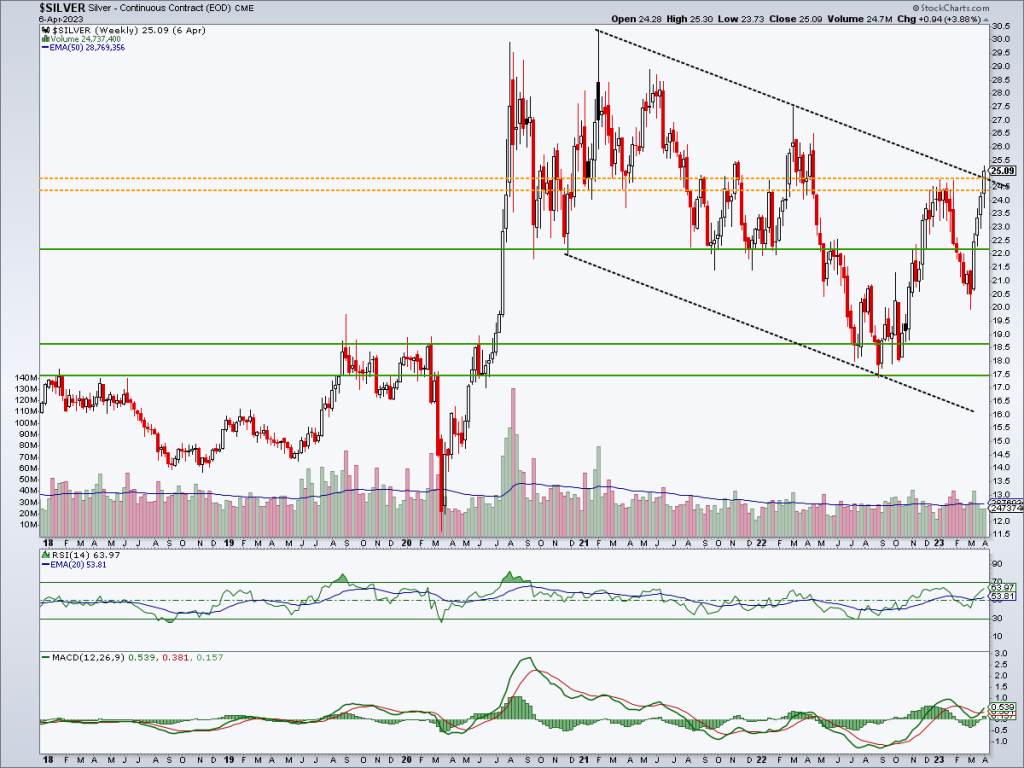
Moving on to silver, we see that gold’s false breakdown as shown above came while silver made a more normal (and ultimately successful) test of important long-term support. Silver then spiked, pulled back hard to test support at the top of the previous corrective cluster and has rammed back upward. Silver is currently working on a resistance area surrounding 24.50. The weekly close above that level and the little poke through the upper trend line is nice, but this is not confirmation of a breakout. More work is needed.
On that note, unlike gold, silver is not particularly overbought. Its rallies often end in bullish hysteria (reference 2020), so this is a positive and silver could have enough fuel in the tank to make a clear breakout. Regardless, short-term volatility aside silver is in a bullish weekly chart posture with positive weekly RSI and MACD.
(Click on image to enlarge)
* At last reading gold’s CoT was approaching warning levels while silver’s CoT was still reasonable. CoT is not a good timer, however.
More By This Author:
Gold Mining Stocks - The Power Of Leverage
Gold And Silver Weekly Chart - Technical Analysis
The Real Price Of Gold


Comments
Log in or sign up to join the conversation.