Gold Analysis: When To Buy Gold?
- Gold prices failed to sustain their upward momentum yesterday, unable to breach the resistance level of $2432 per ounce.
- Clearly, this comes after investors have been closely monitoring U.S. economic data this week to gain clarity on the timing of the expected interest rate cuts by the Federal Reserve.
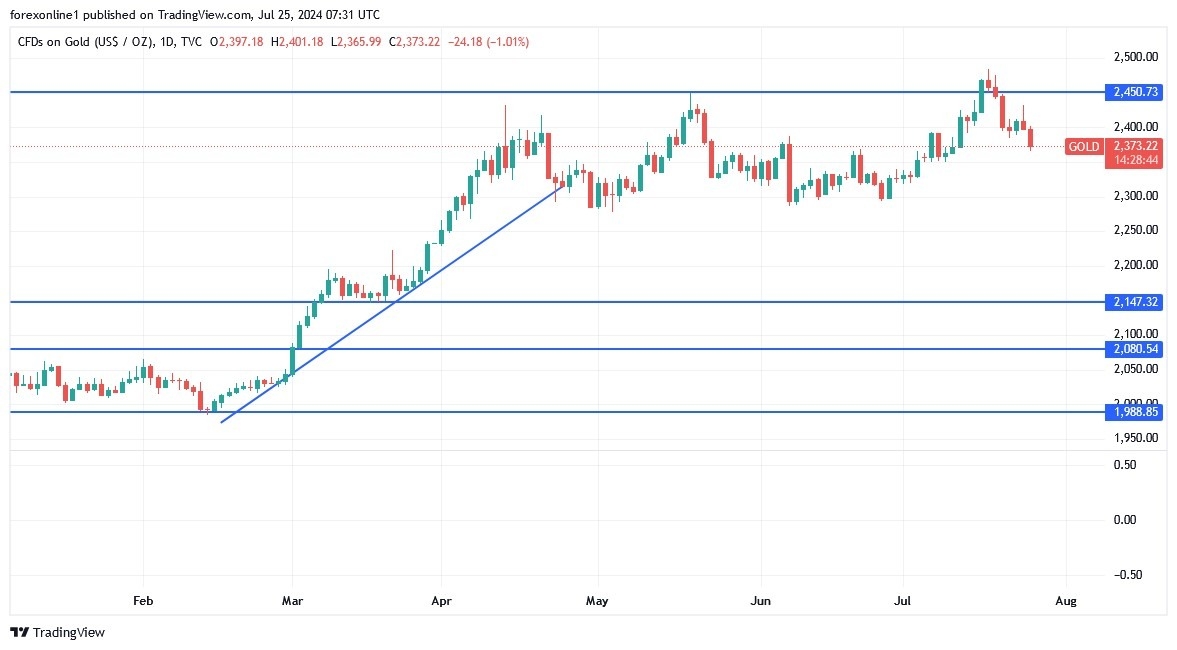
- Concurrently, gold prices have since retreated and are currently trading at a two-week low of $2366 per ounce.
(Click on image to enlarge)
According to economic forecasts, traders are expected to digest the advance reading of second-quarter GDP today and the Personal Consumption Expenditure (PCE) price index for June on Friday. Moreover, the preliminary estimate for second-quarter GDP growth is expected to show an expansion of 2%, up from 1.4% in the first quarter. Also, The PCE price index is forecast to rise by 0.1% after remaining flat in May. Recently, the slowdown in core inflation in the United States has strengthened expectations that the Federal Reserve may begin cutting interest rates in September, with two additional cuts expected before the end of the year.
As for the factors affecting the gold market, the dollar price fell from its highest levels in two weeks. According to trading platforms. The US dollar index DXY fell to 104.1 on Wednesday, after touching a two-week high of 104.5 the previous day, as traders assess new purchasing managers’ indices and monetary policy expectations. The S&P Global Flash Purchasing Managers’ Indexes for the United States showed that private sector activity remains strong, driven by faster growth in the services sectors, while manufacturing unexpectedly contracted for the first time so far this year. Also. input prices rose by the most in four months, but imposed prices declined. Accordingly, the odds of the Federal Reserve cutting interest rates by 25 basis points have now returned to 100%.
According to Forex market trading, the US dollar fell more than others against the Japanese yen and the Swiss franc.
Another factor affecting the market, US 10-year Treasury yields hold near two-week highs. According to trading, the yield on the 10-year Treasury note reached 4.24% on Wednesday, remaining relatively close to the two-week high touched in the previous session as markets continued to assess the Federal Reserve’s monetary policy outlook and the impact of upcoming US monetary policy. Likewise, the president may have a hand in the country’s fiscal balance. New data from the Standard & Poor’s showed that private sector activity expanded at a faster pace in July, supporting the resilience of US growth in the face of higher interest rates and adding some room for the Fed to prolong its tightening policy stance if inflation fails to slow.
However, weak factory performance limited the strength of the survey. Meanwhile, investors continued to assess the momentum that Vice President Kamala Harris’ eventual nomination for the presidential race could have on the possibility of the Democratic Party taking over the executive branch of government. Meanwhile, the expansionary fiscal policies that candidate Trump has indicated have previously led to a rise in long-term yields.
On the stock trading platform front, US stocks are falling sharply. According to trading, US stocks fell on Wednesday, as the Standard & Poor’s 500 lost 1.3%, the Nasdaq fell 2%. Also, the Dow Jones fell 350 points, as traders digested a set of corporate results and the latest PMI data. Furthermore, Alphabet shares fell about 5% to a 6-week low of $174.82 after it beat earnings and revenue but lost YouTube advertising revenue.
Also, Tesla shares fell about 10% after its results were disappointing and it reported a 7% decline in automotive revenue. Moreover, Visa shares fell 3.7% to a 31-week low of $256.7 after slowing payment volumes and processing transactions.
On the other hand, AT&T shares rose 3.8% as wireless subscriber additions beat estimates. Meanwhile, IBM is scheduled to release its report today after the closing bell. On the economic data front, the S&P flash purchasing managers’ index in the US showed that the manufacturing sector contracted unexpectedly for the first time so far this year, while services growth accelerated, and input prices rose by the most in four months.
Gold Price Forecast and Analysis Today:
According to the performance on the daily chart below, the price of gold is leaning towards its downward path that it started in mid-trading this month and will enter buying levels from prices of $2359 and $2335 per ounce respectively. In contrast, and over the same time frame, the psychological resistance of $2400 per ounce will remain an important number for the strength of bulls’ control over the trend. Ultimately, we still prefer to buy gold from every downward level.
More By This Author:
USD/JPY Analysis: Key Level to WatchGBP/USD Analysis: Rebounds to 1.2920 Amid Biden Withdrawal
EUR/USD Analysis: Stability Remains Bearish
Disclosure: DailyForex will not be held liable for any loss or damage resulting from reliance on the information contained within this website including market news, analysis, trading signals ...
more


