
Gold: An Excellent Chance To Buy
Dec. gold and Sept. silver on Thursday extended Wednesday's sharp sell-offs of -2.13% in gold and -2.62% in silver. Precious metals prices saw weakness on early strength in the dollar index, although the dollar faded during the afternoon. Precious metals prices have seen weakness in August on long liquidation pressure after the sharp rally seen since the beginning of the year due to the pandemic and the Fed's extraordinarily easy monetary policy.
Safe-haven demand and dovish central bank expectations have sparked fund buying of precious metals in recent months. Long gold positions in ETFs on Aug 6 rose to a new record high of 3,388.41 metric tons (data since 2002). Also, long silver positions in ETFs rose to a new record high of 893.743 million troy ounces last Friday.
The fundamentals continue to be strong for precious metals. Unemployment rates remain high. Governments around the world continue to print money and to provide massive amounts of stimulus. The coronavirus shows little sign of going away any time soon. News about vaccine development is showing promise, but any vaccine on a global scale is at least months away. With a US election in November, political instability could further impact the US economy, scaring more people into the precious metals markets. Tensions with China are rising. The ability of central banks to use the paper markets to depress the price of gold and silver has ended as demand has surged in the physical market far beyond anything the paper market can manipulate. Gold and silver, long term, are bullish fundamentally.
Gold
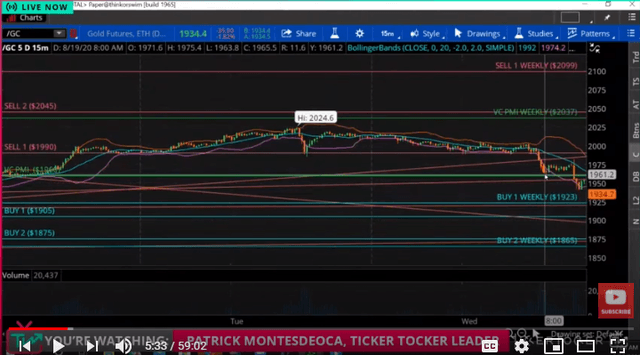
Gold is trading last at $1,935.70. For today, the Variable Changing Price Momentum Indicator (VC PMI) daily average price is $1,960. The extreme level below (Buy 1) is $1,905 and the Buy 2 level is $1,875. The extreme level above (Sell 1) is $1,990 and the Sell 2 level is $2,045.
For the daily signals, the market is trading below the average price, so it indicates a bearish price momentum. Gold came down through $1,960 and activated the bearish price momentum. This is the sentiment of the market. Once down through that average price, the target for the daily was $1,905.
Courtesy: Ticker Tocker
The average price weekly is $1,963, the Buy 2 level is $1,776 and the Buy 1 is at $1,865. The daily and weekly average prices are almost the same, $1,960 and $1,963. So, they are harmonically aligned. The market came up to the Sell 1 level, almost to the Sell 2 level, with $2,045 to $2,052 is another almost harmonic alignment. Supply or sellers began to enter the market as the price rose. There was not enough buying demand to reach the Sell 2 level, so the market came down to the level below of $1,990. It then traded around that area until it activated a short trigger at 7:30 am on the 19th from about $1,990. The daily target was the mean below, which the market then met.
The VC PMI recommends not trading futures around the mean since there is a 50/50 chance of the market rising or falling from that area. You should wait for the highest probability trades when the market comes down to the Buy 1 or 2 level or up to the Sell 1 or 2 level. The market is in a bearish sentiment. The closer gold gets to $1,905, the lower the market goes, the more likely that the market will then revert back to the mean.
The weekly average is $1,963. The market closing below that level automatically activates the target below of $1,905. The weekly target is the Buy 1 level of $1,865. Gold is trading below the average price, but it appears to be building a base at the Buy 1 level. We want to see either the market coming down to $1,905 and activating that trigger, or closing above $1,963 on the 15-minute bar to activate a bullish momentum, which would activate the targets of $1,990 and $2,045.
VC PMI Monthly Data Points
Courtesy: TDAmeritrade
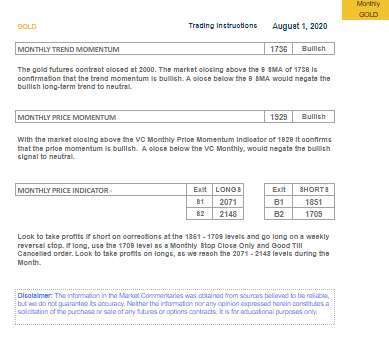
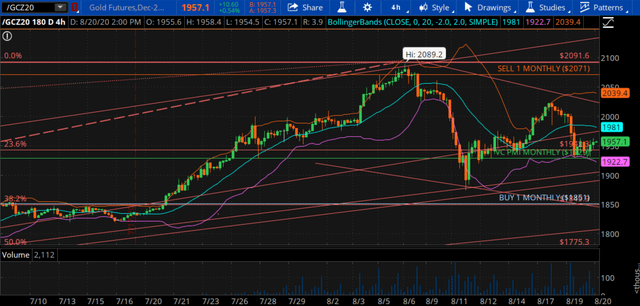
At the beginning of August, we published our monthly VC PMI report. The market was around $2,000 at the start of the month. The VC PMI identified the trend momentum at $1,736, which meant the market was bullish. The monthly VC PMI was $1,929, the average price, which was also bullish. The market closing above that level was another bullish indicator. The levels of $2,071 to $2,148 were the targets for the rest of the month. If gold closed below $1929 stop, it would negate this bullishness to neutral. The gold market since we published the report has completed the target of $2071. The report then told you to take profits at that level. From the monthly high, the market then reverted back down on a $100 move, which started from a VC PMI short trigger at the Sell 1 level. It came down to $1,874, before reverting right back up above the average price. It negated the bearish sentiment activated when the market came down before it then triggered a bullish trend momentum for the rest of this month. Now, we are trading above the monthly average price, which indicates a bullish trend.
As a self-directed trader, the first time the price reaches the objective, you should reduce your position, hedge or go neutral. The annual VC PMI report also pointed to these levels as a high probability that supply would come into the market.
We are trading just below the daily and weekly averages, but above the monthly average of $1929. Right below it are trigger levels, which indicate it is highly likely that a reversion will occur if those levels are activated. We are on a bullish bias for the monthly data, so we are holding onto derivatives for the long term. We are waiting for the price to close above $1,960 to $1,963, which will activate the bullish price trend momentum. It will be a strong signal since the daily, weekly, and monthly levels are in harmony. Hold onto your long positions. If you are just coming into the market now, this is a good place to add at least 10% of your committed capital to gold. The market coming down to $1,865 is going to be the basis for the next leg up. This was an ideal correction, in giving us an incredible opportunity to add to the long side of the market. In the $2,045 area, we have all three trends in harmony.
Silver
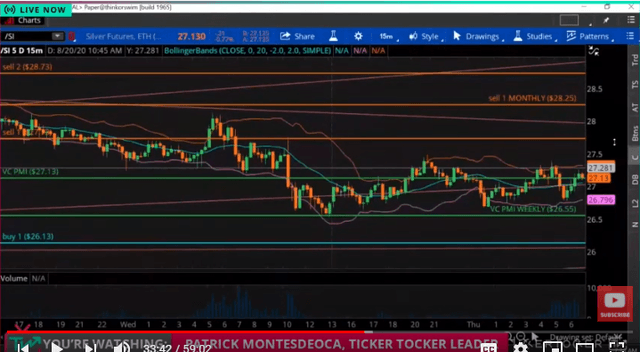
Silver is trading around the average price. The daily average is $27.13 and the weekly is $26.55, so we're trading between those averages. Trading above those levels is bullish, trading below is bearish. This area is 50/50 that the market will go up or down from this area, so don't trade in this area. It will be pretty choppy in this area. It is holding this average. We want to see a test of $26.13 to $25.53 or a test again of the recent highs. The Sell 1 level is $27.74. Trading above the average activates the Sell 1 level as the first target. The Sell 2 daily level is $28.73, but the monthly is at $28.29. Above $27.70, you begin to see the area of distribution of supply. There is a high probability of reversion back to the mean from these levels. This does not mean it is the top of the market. The $26 area would activate a buy trigger, which it did, completing the Sell 1 level and almost reaching the Sell 2 level.
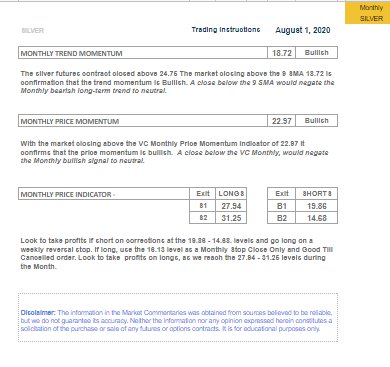
August 1, silver was at $24.93 when we published our monthly silver VC PMI report. In that report, we wrote that because silver closed above the monthly average of $18.72, it was bullish. A close below $22.97 stop would negate this bullishness to neutral. If long, the VC PMI recommended taking profits at $27.94 to $31.25, if you were long. Silver reached $28.60, so silver activated the first level for the month of $27.94. Knowing this level, you could lock in profits or hedge when silver reached that level.
Silver has traded $4 moves in a matter of days, which offers a major opportunity to make some money. Gold is also extremely volatile. In September of last year, gold was around $1,500 and it reached $2,000. These are historic moves in the precious metals markets and it is a trader's dream come true. The volatile markets offer the chance to make major profits. The more technical you are in today's markets, the more successful you are going to be. The fundamentals broke in March. Then, the market and economy became virtual. The algorithms of the market took over. It was a blessing because it helped keep the US from collapsing.
E-Mini S&P
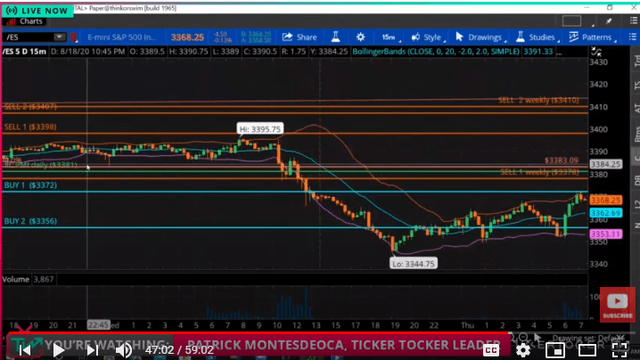
The E-mini S&P high was 3,395. The average price for today is 3,381. The extreme below (Buy 1) is 3,373 and the Buy 2 level is 3,356. The market came down at 12:45 pm into the area that the VC PMI identified as a high probability of finding buyers, near Buy 1 and Buy 2. This is an area at which to build a position if you are a multiple size trader. From Buy 1 there is a 90% probability of the price reverting back up to the mean, From Buy 2, there is a 95% chance of a reversion back to the mean.
The daily and weekly numbers are nearly in harmony. The weekly Sell 2 level is 3,410 and the Sell 1 level 3378. The average weekly price is 3,317, 3,285 is the Buy 1 level and 3,224 is the Buy 2 weekly level.
The E-mini is in an area of support. It activated a buy trigger and completed the target rather quickly. If the price closes above 3,372, it would activate another buy trigger or it may trade within these levels.
JNUG
We use JNUG, an ETF, to trade aggressively. It is a duple X ETF in the area of the gold market. It is not an instrument to hold long term. You can use it to manage risk short term; a few days at most. It is very volatile. You can take the same amount of money as you would spend in futures margin and use it in JNUG without the risk of a margin call. Not everyone can trade futures contracts, so JNUG offers an instrument for those who don't want to risk margin calls.
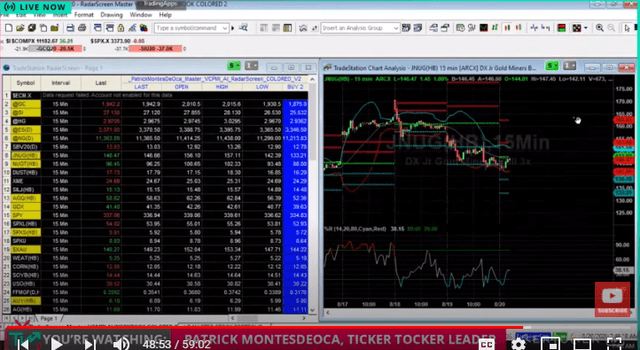
NUGT
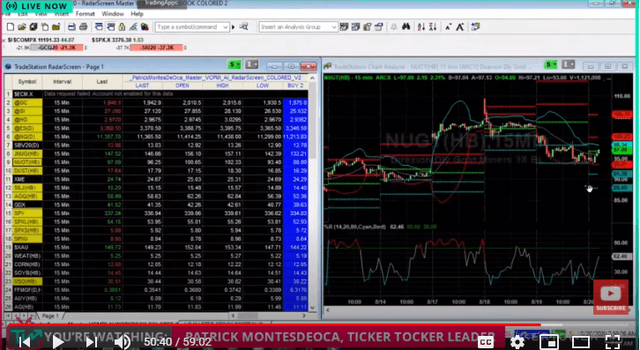
NUGT is activating a bullish trend momentum. It is up 2 or 3%. These instruments are extremely volatile. Some of these ETFs can provide 30% returns in a day. In March, NUGT went from $25 down to $6 during the collapse and has roared back up to almost $100 a share. You must be prudent in managing the risk, but such instruments can provide an excellent opportunity to make a good return.
The VC PMI
We use the VC PMI for day, swing and position trading. We focus on what the market is telling us about the price, while ignoring all the chatter in the media and on business channels and sites. The market is determining the balance between the supply and demand, so the VC PMI shows you where the market is likely to go based on supply and demand, and reversion to the mean. We mainly trade gold, silver and the E-mini S&P. Gold offers thousands of derivatives, which offer a vast range of risk levels and sizes--all of which can be traded based on the VC PMI.
Disclosure: I am/we are long GDX. I wrote this article myself, and it expresses my own opinions. I am not receiving compensation for it (other than from SA). I have no business relationship ...
more


Good read. Very bullish on gold.