
Gold & Silver Officially Confirm Their Breakouts
With a surge in volume and breakouts across major world currencies, gold and silver confirmed yesterday the breakouts that began on Friday, paving the way for the resumption of their bull markets.
Yesterday was a very exciting day because gold and silver both officially broke out, giving the green light for powerful rallies into year-end. This is the scenario I’ve long been anticipating as summer wrapped up and Wall Street returned from vacation mode.
Yesterday, gold surged 1.64% to reach another all-time high of $3,533.55, while silver jumped just under 3% to hit a 14-year high of $40.88. While many are pointing to the pullback in U.S. stocks and long-dated Treasuries as the main catalyst for yesterday’s precious metals rally, I believe the move is primarily technical in nature.
As I explained a month ago, this breakout was already long in the cards. In my view, gold and silver had been coiling like compressed springs, and now that pressure is being released, they are finally taking off.
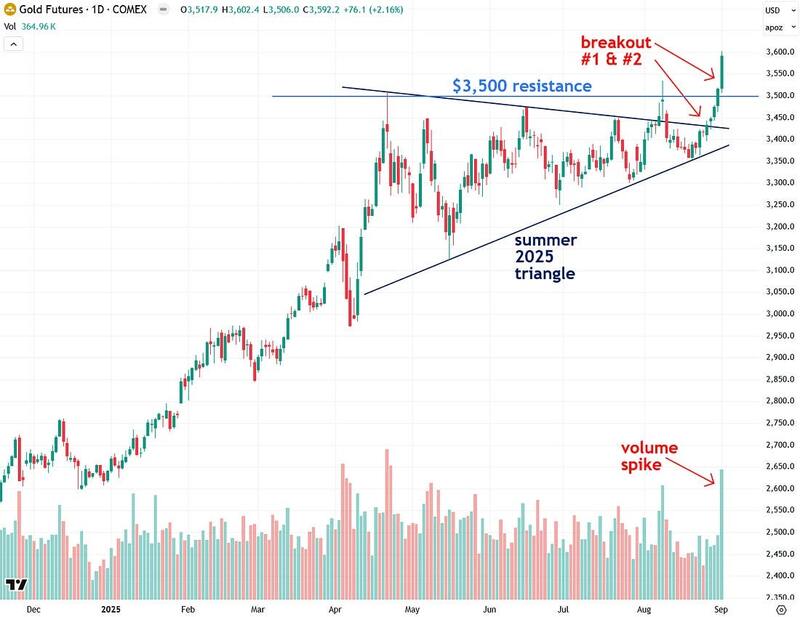
Now let’s take a look at the charts, starting with COMEX gold futures. COMEX gold has officially broken out of its Summer 2025 triangle pattern, as well as above the key $3,500 resistance level I had been watching for additional confirmation.
Breakouts above horizontal resistance levels tend to carry more weight than those above diagonal ones, which is why this development is especially significant.
I was also looking for a surge in volume to validate the breakout, and sure enough, we saw that in droves yesterday—a very encouraging sign that the so-called “smart money” is behind this move. With gold’s triangle pattern now decisively broken, there is a high probability that it will rally toward a target of at least $4,400.
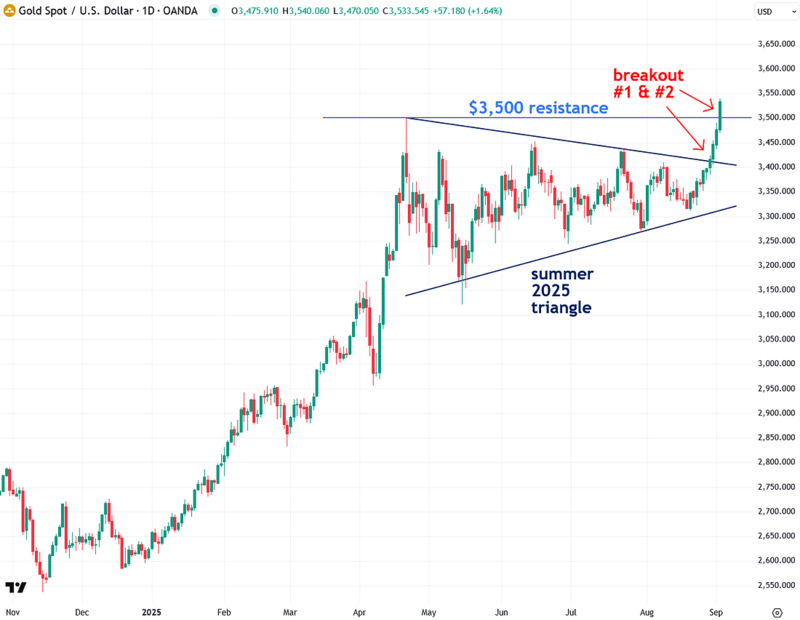
Next, let’s take a look at the spot price of gold in U.S. dollars. Like COMEX gold futures, the spot price has now broken out of its Summer 2025 triangle pattern and above the key $3,500 resistance level, which was the high from April. This is a very encouraging sign.
I had been waiting for both COMEX gold futures and the spot price to break out and send the same message. The two have diverged more than usual lately due to the distorting effects of the Trump administration’s tariff plans and the speculation surrounding them.
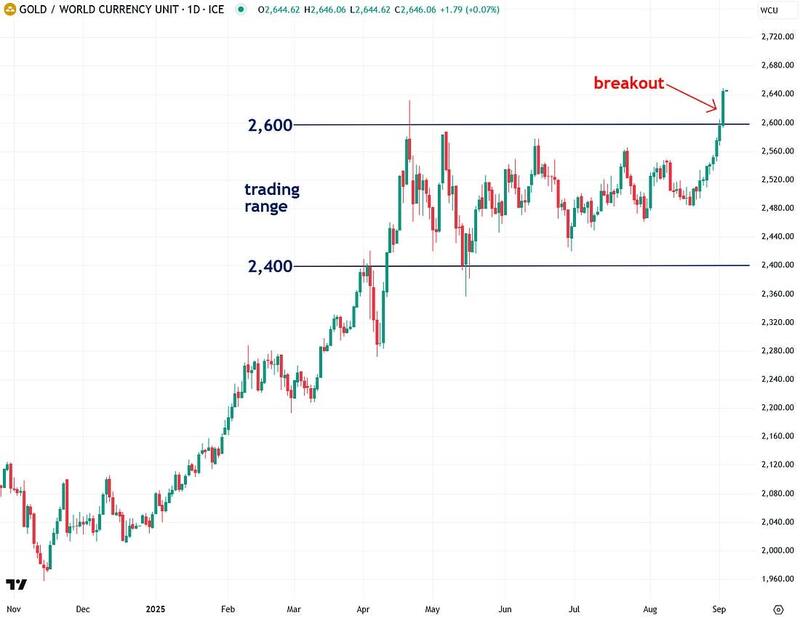
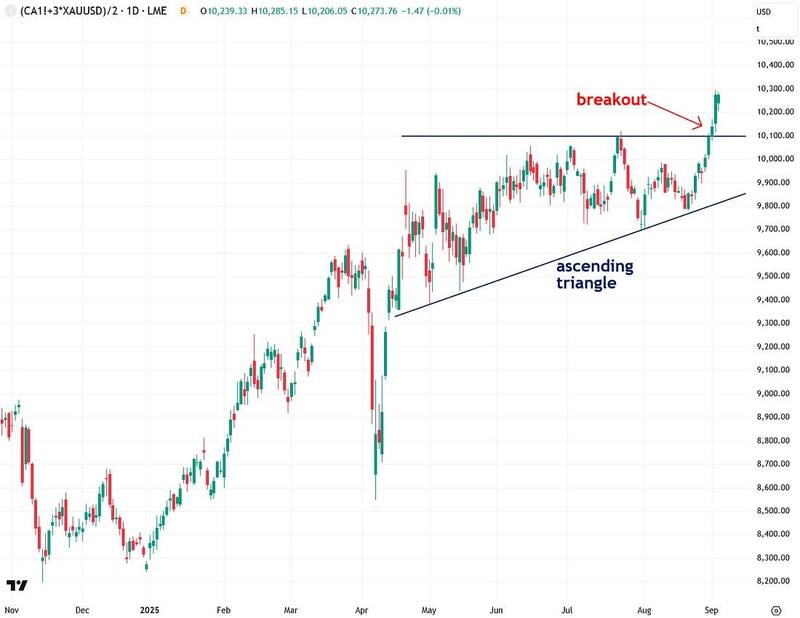
I’ve recently begun tracking gold priced in the World Currency Unit (WCU)—a composite currency based on the GDP-weighted average of the world’s 20 largest economies.
In many ways, it offers one of the most balanced and accurate reflections of gold’s true global performance, which is why I’ve been paying close attention to it.
Since its April peak, gold priced in WCU (World Currency Units) was consolidating within a trading range between 2,400 and 2,600.
It finally closed above the 2,600 resistance level yesterday, which is a major sign of strength and confirmation that the summer consolidation is over and that gold’s bull market is resuming.
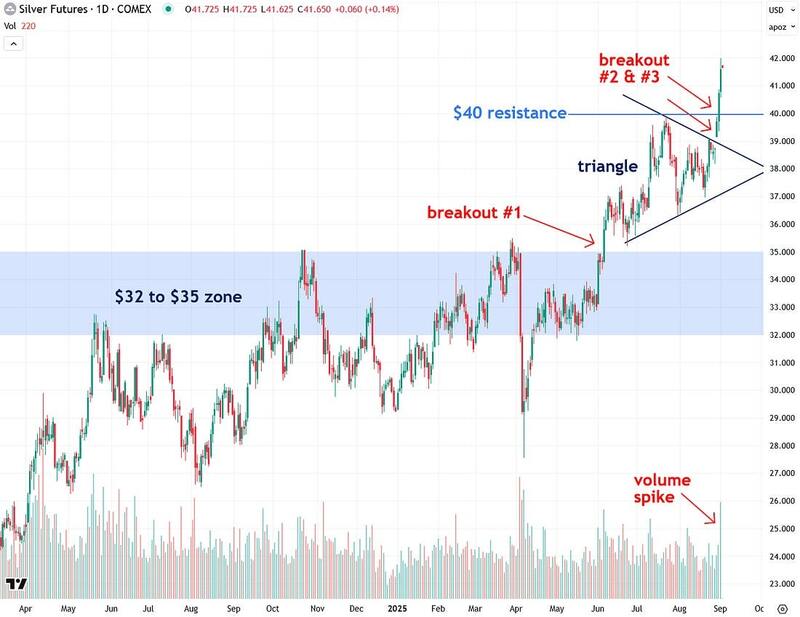
Next, let’s turn to silver, starting with COMEX silver futures. COMEX silver broke out of a triangle pattern last week, which is a very bullish signal, and then pushed above the key $40 resistance level I had been watching.
This level marked the late July peak and is especially important because horizontal resistance levels tend to carry more weight than diagonal ones.
I had also been looking for a surge in volume to confirm the breakout and signal that the smart money is backing this rally—and we got exactly that yesterday, which is very encouraging.
Right now, all systems are go for silver, and the next stop is $50 and higher, possibly as soon as this month, as I explained recently.
Adding to the excitement is the fact that the Synthetic Silver Price Index (SSPI), a proprietary indicator I developed to confirm whether moves in silver are genuine or simply noise or manipulation, has just broken out of the ascending triangle pattern that has been forming over the past five months.
This breakout indicates that both the SSPI and silver are now entering powerful new phases of their bull markets.
Last week, I wrote about the major volatility squeeze forming in the SSPI and explained why it was likely signaling a big move in both the SSPI and silver. That move is now clearly underway.
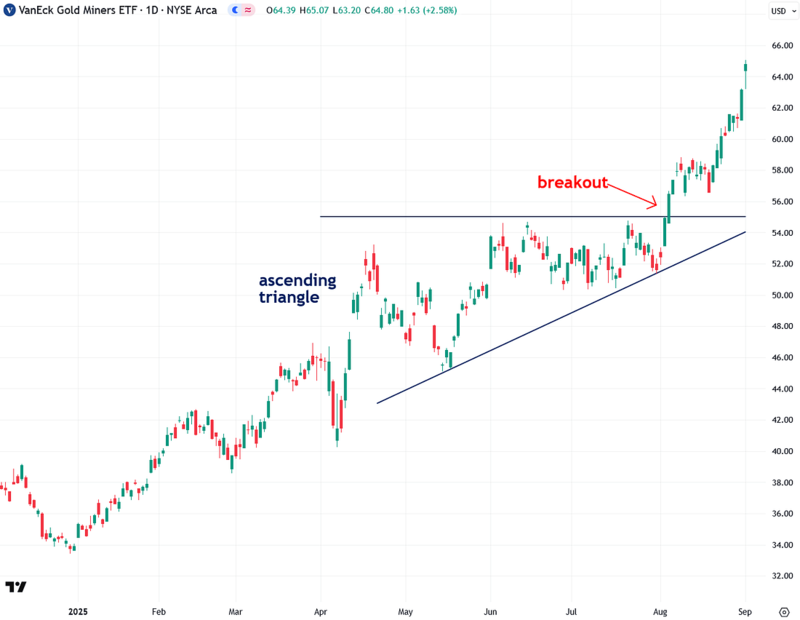
Gold mining stocks, as measured by the VanEck Gold Miners ETF (GDX), continue to gain momentum after breaking out of their ascending triangle earlier this month.
With multiple factors now aligning in their favor, I believe we are still in the very early stages of the bull market for gold miners.
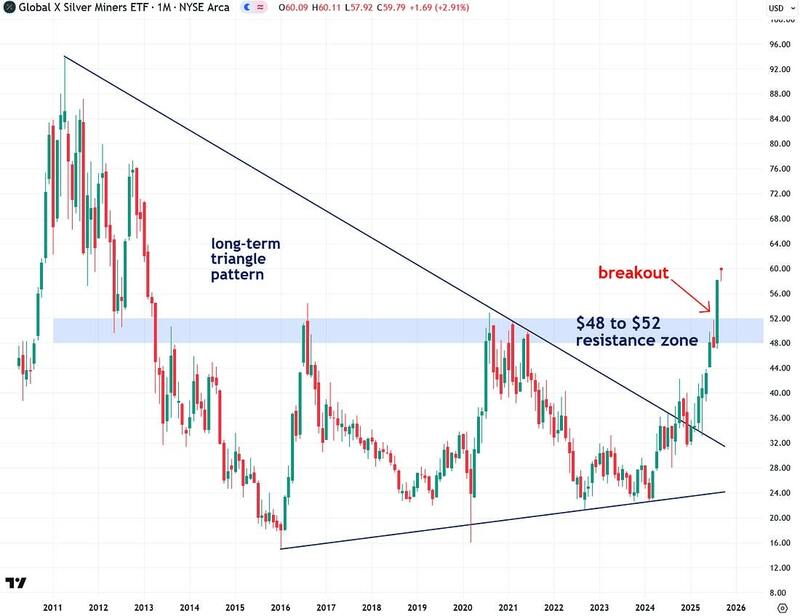
In addition to being bullish on gold mining stocks, I am also very optimistic about silver mining stocks and will be publishing a detailed report on them soon.
The monthly chart of the Global X Silver Miners ETF (SIL) shows a decisive breakout above the critical $48 to $52 resistance zone that has capped gains since 2016, which I view as a major bullish signal.
To summarize, gold, silver, and mining stocks have now fully broken out of their summer consolidation patterns and are in confirmed uptrends. I expect their rallies to continue at least through the end of this year, with gains likely to be explosive as public awareness and participation increase.
Although gold and silver have already performed exceptionally well over the past eighteen months, I do not believe they are too high or have gotten ahead of themselves.
Precious metals bull markets typically last ten to fifteen years, and I expect this one to follow a similar path. It is great to see the stars align and to watch our favorite investments finally surge and begin receiving the recognition they deserve.
More By This Author:
Why Silver May Hit $50+ In SeptemberA Major Move Is Ahead For Interest Rates
Precious Metals Surge After Dovish Jackson Hole Speech
For the author's full disclosure policy, click here.


