Gold & Oil: Another Inflationary Wave?
The gold (and silver) charts look awesome. That’s large because of the US government’s latest failed war (Ukraine), botched brown to the green energy transition, and the rise of the gold-oriented citizens of the East.
(Click on image to enlarge)
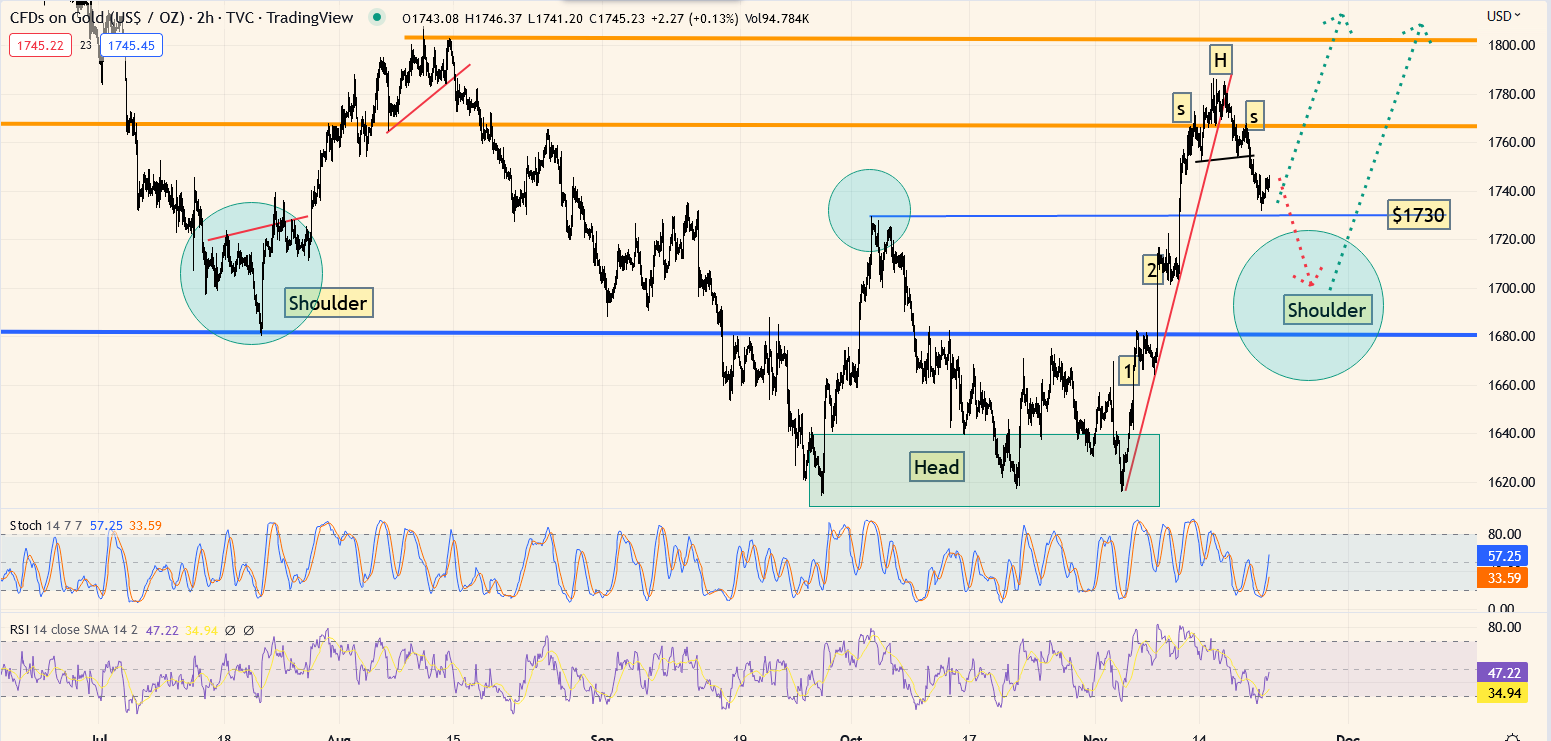
spectacular short-term gold chart.
I suggested the rally from $1614 would likely pause in the $1660-$1670 zone and a right shoulder of a big H&S pattern would begin to form.
The shoulder could already be complete at the $1730 support zone and a move to $1680 would simply add symmetry to what is already an aesthetic and incredibly positive pattern.

The US government’s “solution” to the Ukrainian problem has been to pound Russia with sanctions that have created staggering inflation and hardship for millions of Eurozone citizens.
As winter begins, the plight of the citizens of Ukraine and Europe will worsen significantly, and the US government will continue the same vicious “My way or the highway” approach that it used to wreck Iraq, Syria, and Libya. America has failed badly in most of its violent regime change schemes and wars… and the Ukraine war failure could be the biggest of them all.
Why is this important for gold?
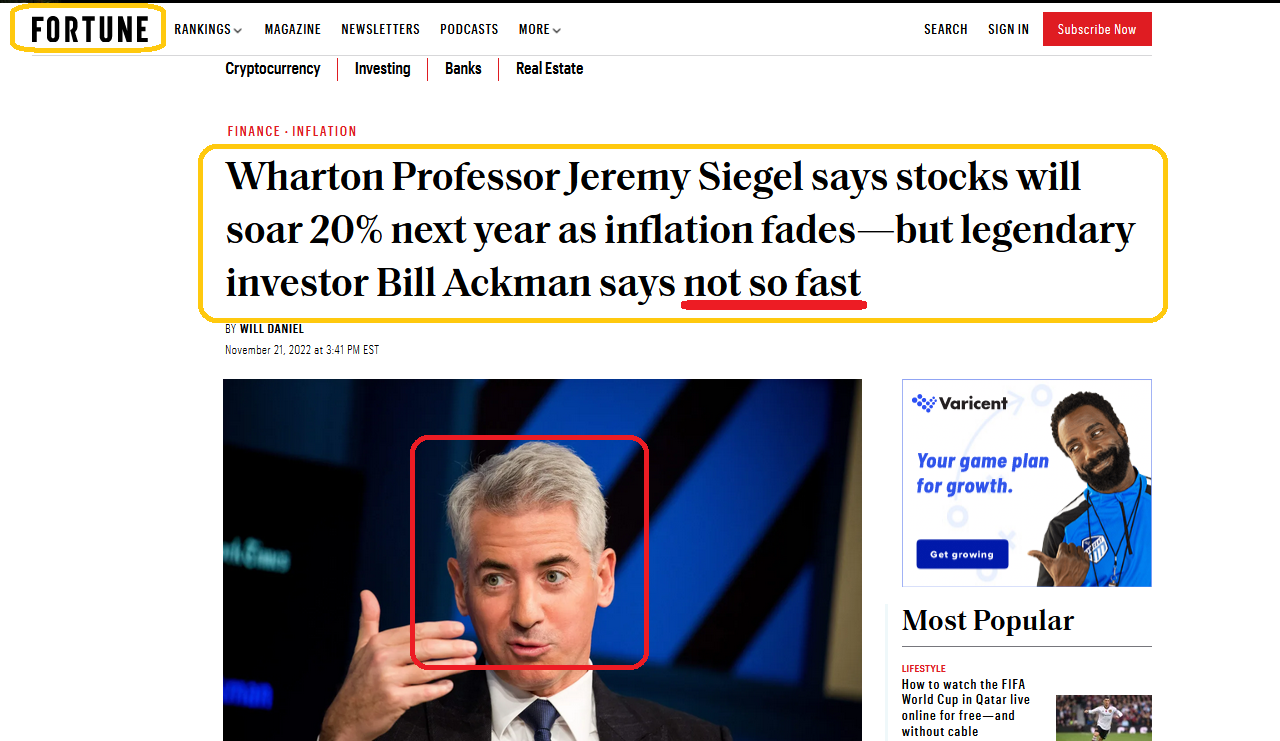
Unlike the wars in the mid-East, the sanctions used in this war are creating systemic inflation. It’s not transitory. It’s the opposite of transitory, which is systemic.
Analysts like Siegel believe that sanctions-oriented inflation and deglobalization can be overcome with a few small rate hikes from the Fed. They seem to believe (wrongly) that systemic supply-oriented inflation is the same as inflation created by a strong economy.
Other analysts, like Bill Ackman, have a more realistic view of the systemic nature of the current inflation. Can inflation from sanctions, destroyed Nord Stream pipelines (and soon the war in Taiwan?) be papered over with a few rate hikes? This is highly unlikely.
I’ve been adamant that Fed man Jay is very concerned about the drag on the US economy created by the US government’s size, debt, and global meddling. Unfortunately, neither the republicans nor the democrats have shown much interest in dramatically reducing the size of the government. Lip service has been paid to the issue, but that’s not enough.
The only way for the Fed to reduce that drag is with higher rates. The good news is that it appears the Fed has finally decided to step into the void and “walk the talk”. The reason the Fed hasn’t “blinked” is that the government is ramping up its inflationary sanctions rather than eliminating them.
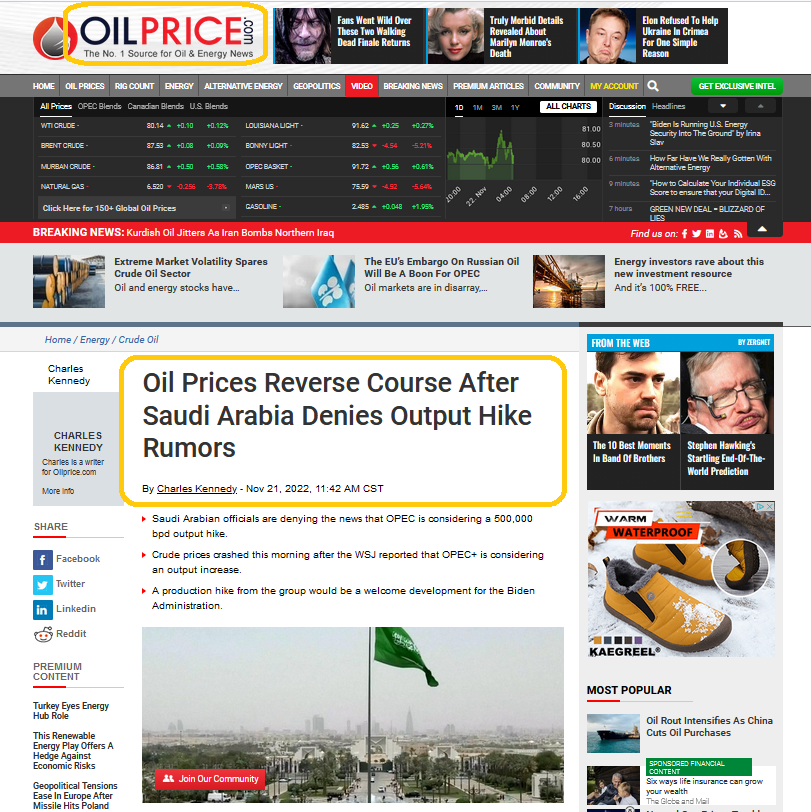
While it’s only one in what seems to be a near-infinite list of failures, the US government’s relationship with the Saudi government is rapidly deteriorating. The latest is the bizarre move to ban Khashoggi’s wife from suing the Saudis for her husband’s gruesome murder. The US side likely hoped this would entice the Saudis to increase oil production. This new scheme has clearly failed:
“If there is a need to take further measures by reducing production to balance supply and demand, we always remain ready to intervene.” - Saudi Energy Minister Prince Abdulaziz bin Salman, Nov 21, 2022. The bottom line: Instead of doing production increases to please the US side, the Saudis are focused on cuts!
(Click on image to enlarge)
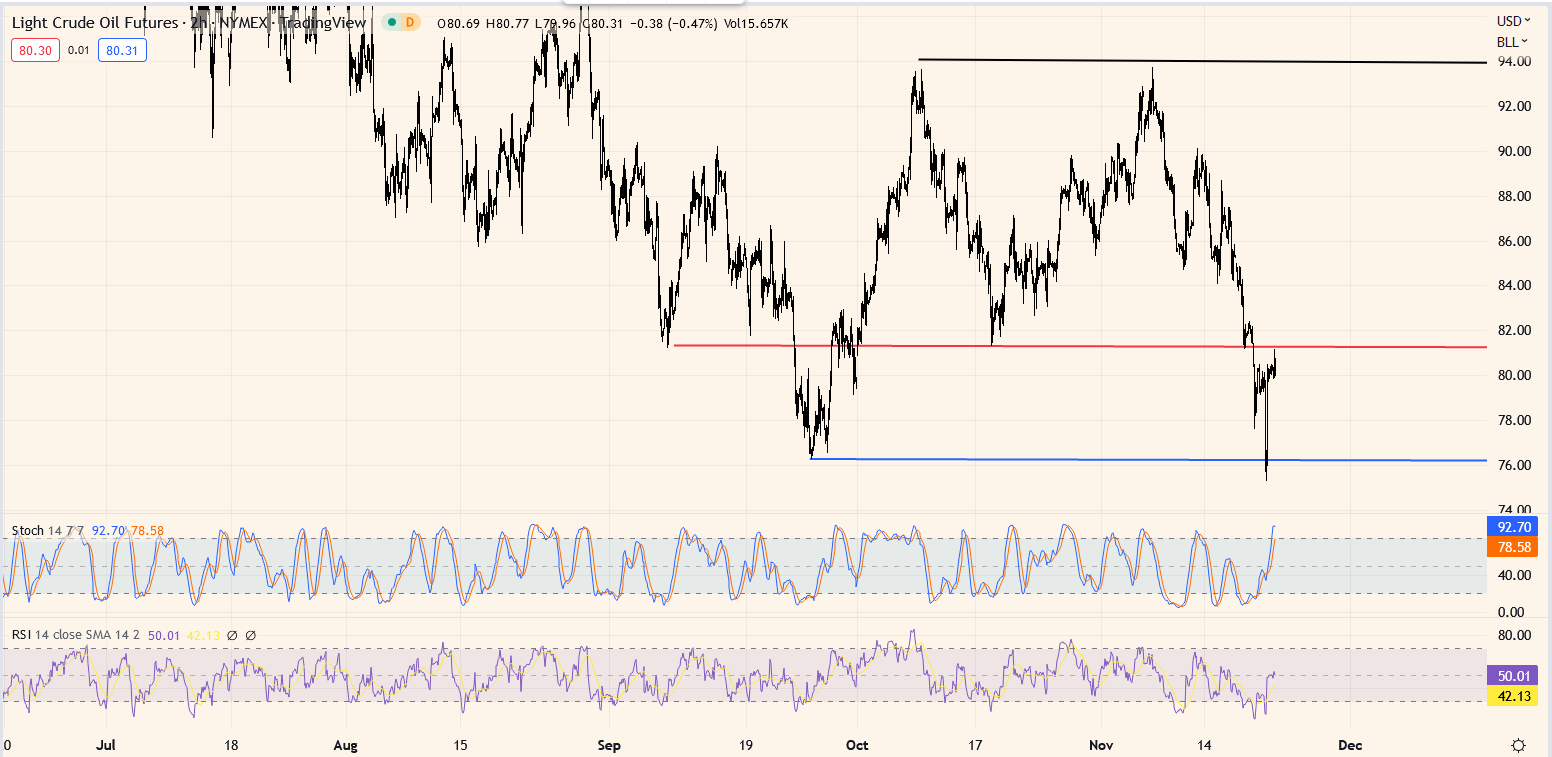
Does yesterday’s shocking reversal mark an end to the oil price reaction and the start of a new leg higher for inflation… just when many stock market investors think it’s safe to jump back into the pool?
For further insight into the matter
(Click on image to enlarge)
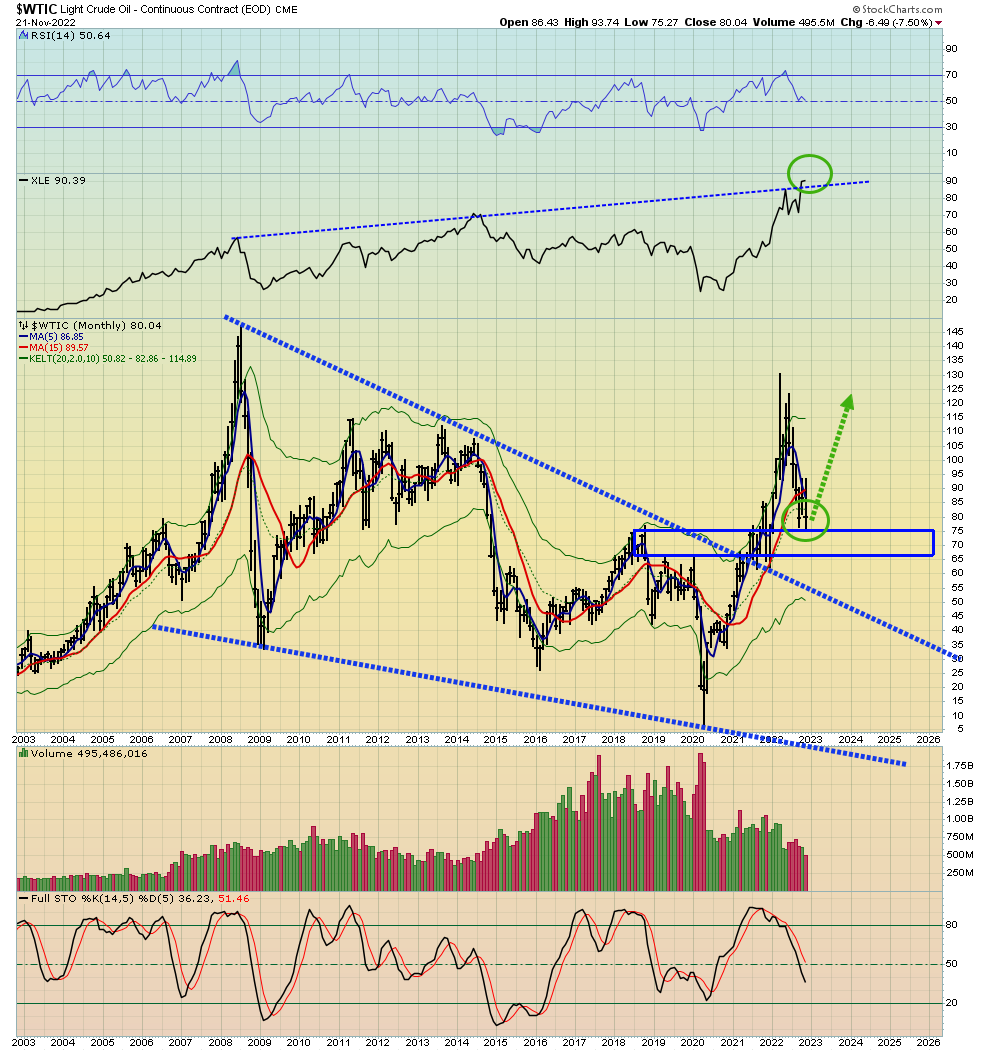
weekly oil price chart.
The entire $65-$75 zone is powerful support. It could serve as a launchpad for a rally back to $100. Note the action of the XLE oil stocks ETF at the top of the chart. It’s been staging a positive divergence with the oil price, and suddenly oil looks set to function as a “booster rocket” for oil stocks!
Also, Europe has bought a lot of Russian oil in recent months but that’s likely to end abruptly with the upcoming oil price cap. US sanctions have ravaged Europe with inflation, and the oil cap scheme could essentially put that situation on steroids. In a nutshell: The winds of recession have begun to blow in America, and they could soon be augmented with fresh winds of oil price inflation.
(Click on image to enlarge)
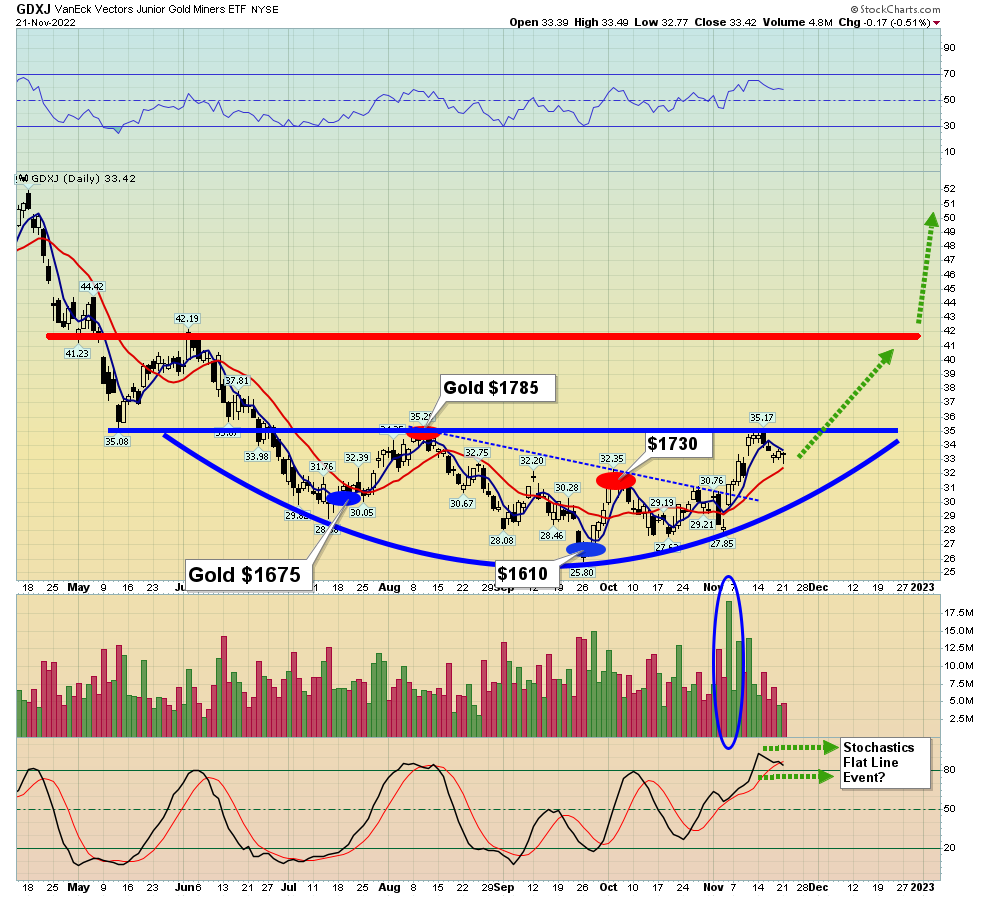
GDXJ chart.
The price pattern looks like a gold-powered flying saucer, ready for launch! Note the massive “game-changing” volume bar highlighted in blue.
A Friday close over $35 is the launch signal.
(Click on image to enlarge)

That Friday close for GDXJ would likely be followed by a breakout from the huge bull wedge pattern on this CDNX chart.
(Click on image to enlarge)
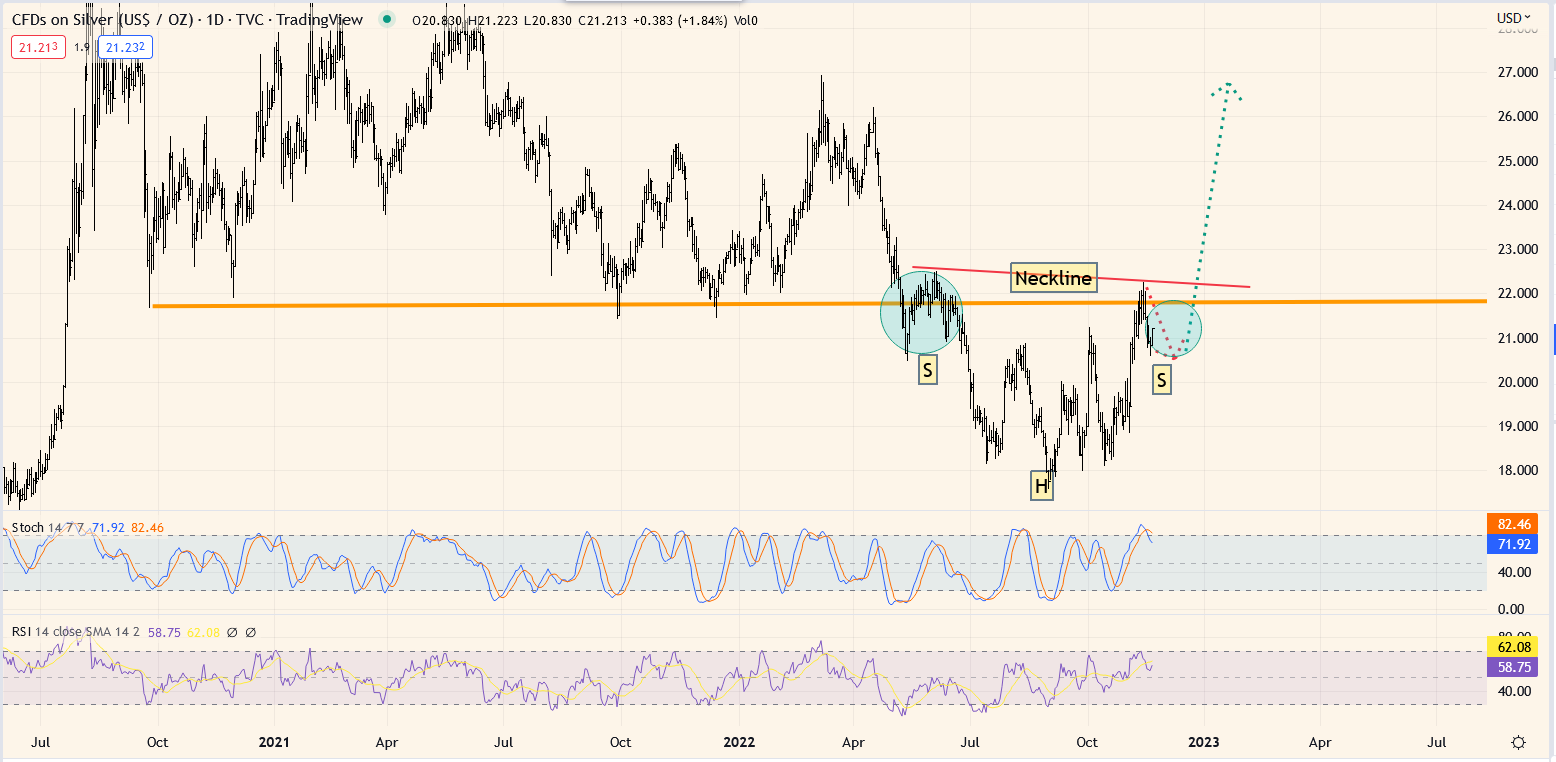
daily silver chart.
A beautiful inverse H&S pattern is in play. The right shoulder is forming now.
A Friday close over the neckline and above $22.50 should see silver surge to $27.
For a look at the senior miners
(Click on image to enlarge)
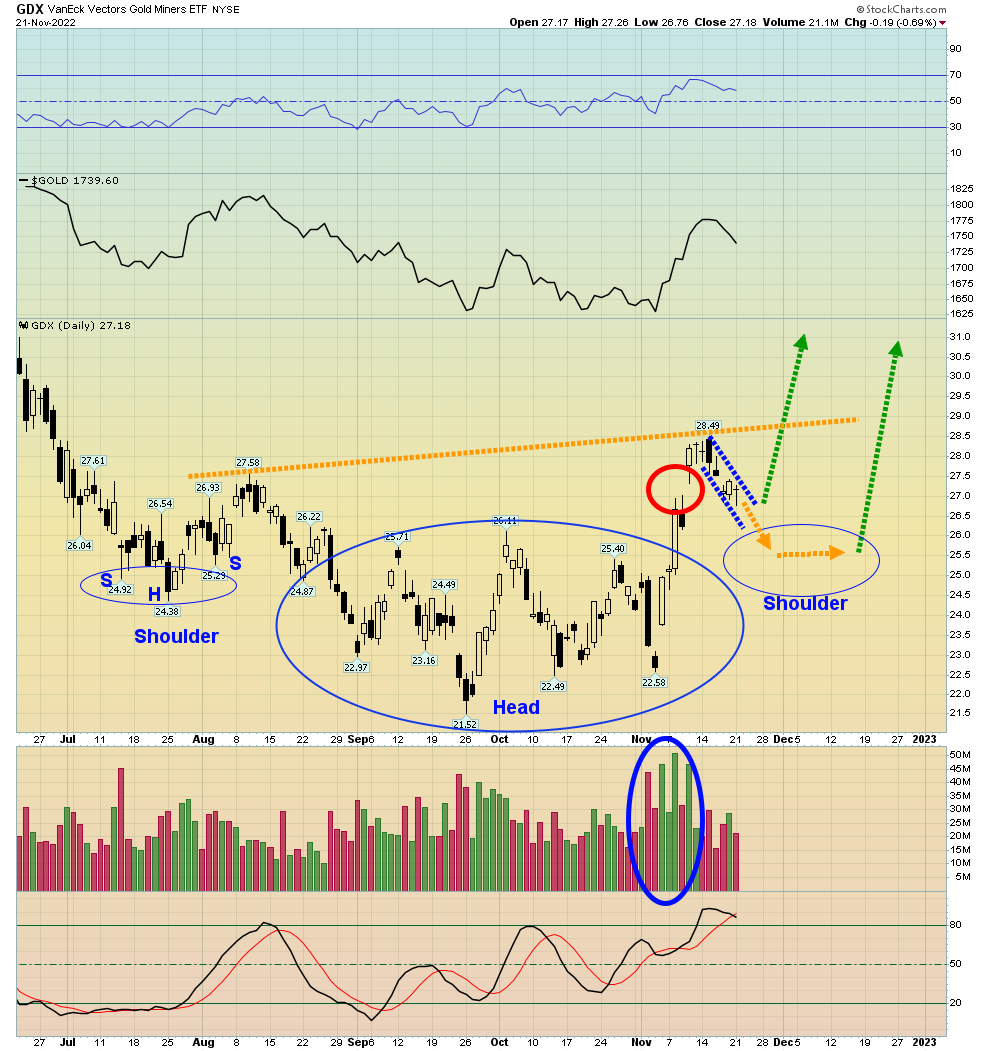
bullish GDX chart.
It was around this time last year that gold began surging as oil rocketed to $130. Is history set to repeat? Well, perhaps it is and the current turmoil in the oil market could make the GDX right shoulder into a nice bull flag.
Investors with no mining stock core positions can buy somewhat aggressively right now.
It looks more and more like 2023 will be a “Golden Year”, with inflation and a lot of mighty miners consistently surprising to the upside!
More By This Author:
Gold Charts: A Bullish ShineThe U.S. Election And A Vote For Gold
The US Election & A Vote For Gold


