Gold – Has The Summer Rally Already Begun?
After the sharp drop in the first half of June and a tenacious sideways bottoming out, the gold price recovered to US$1,834 and thus reached its 200-day moving average (US$ 1,827) again. Gold – Has the summer rally already begun?
Review
Since gold prices reached a new all-time high at US$2,075 on August 7th, 2020, the entire precious metal sector has been in a multi-month correction. After eight months within this correction, gold fell back to an important double low at around US$1,676 in mid and late March. From there, prices recovered strongly in April and May. This wave up ended at US$1,916 (+14.3% in eight and a half weeks). Subsequently, gold prices came under strong selling pressure once again. A quick and steep sell off took prices down by US$142 within just one week between June 11th and 18th. But it was not until June 29th that the gold market finally found its turning point at US$1,750. From here, an initially tenacious but step by step more dynamic recovery towards US$1,834 began. Over the last few days, gold slipped back below US$1,800 only to recover quickly back to US$1,815.
While central bankers, politicians, and the media have been talking down the increasing fears of inflation (US consumer price index +5.4% in June), gold was only able to recover slowly from the severe pullback in June. Nevertheless, gold current trades about US$65 higher than at its low point a three weeks ago. Is this the end of the typical early summer correction in the precious metals sector or is there still some more downside to come?
Technical Analysis: Gold in US-Dollar
Weekly Chart – The series of higher lows remains intact
(Click on image to enlarge)
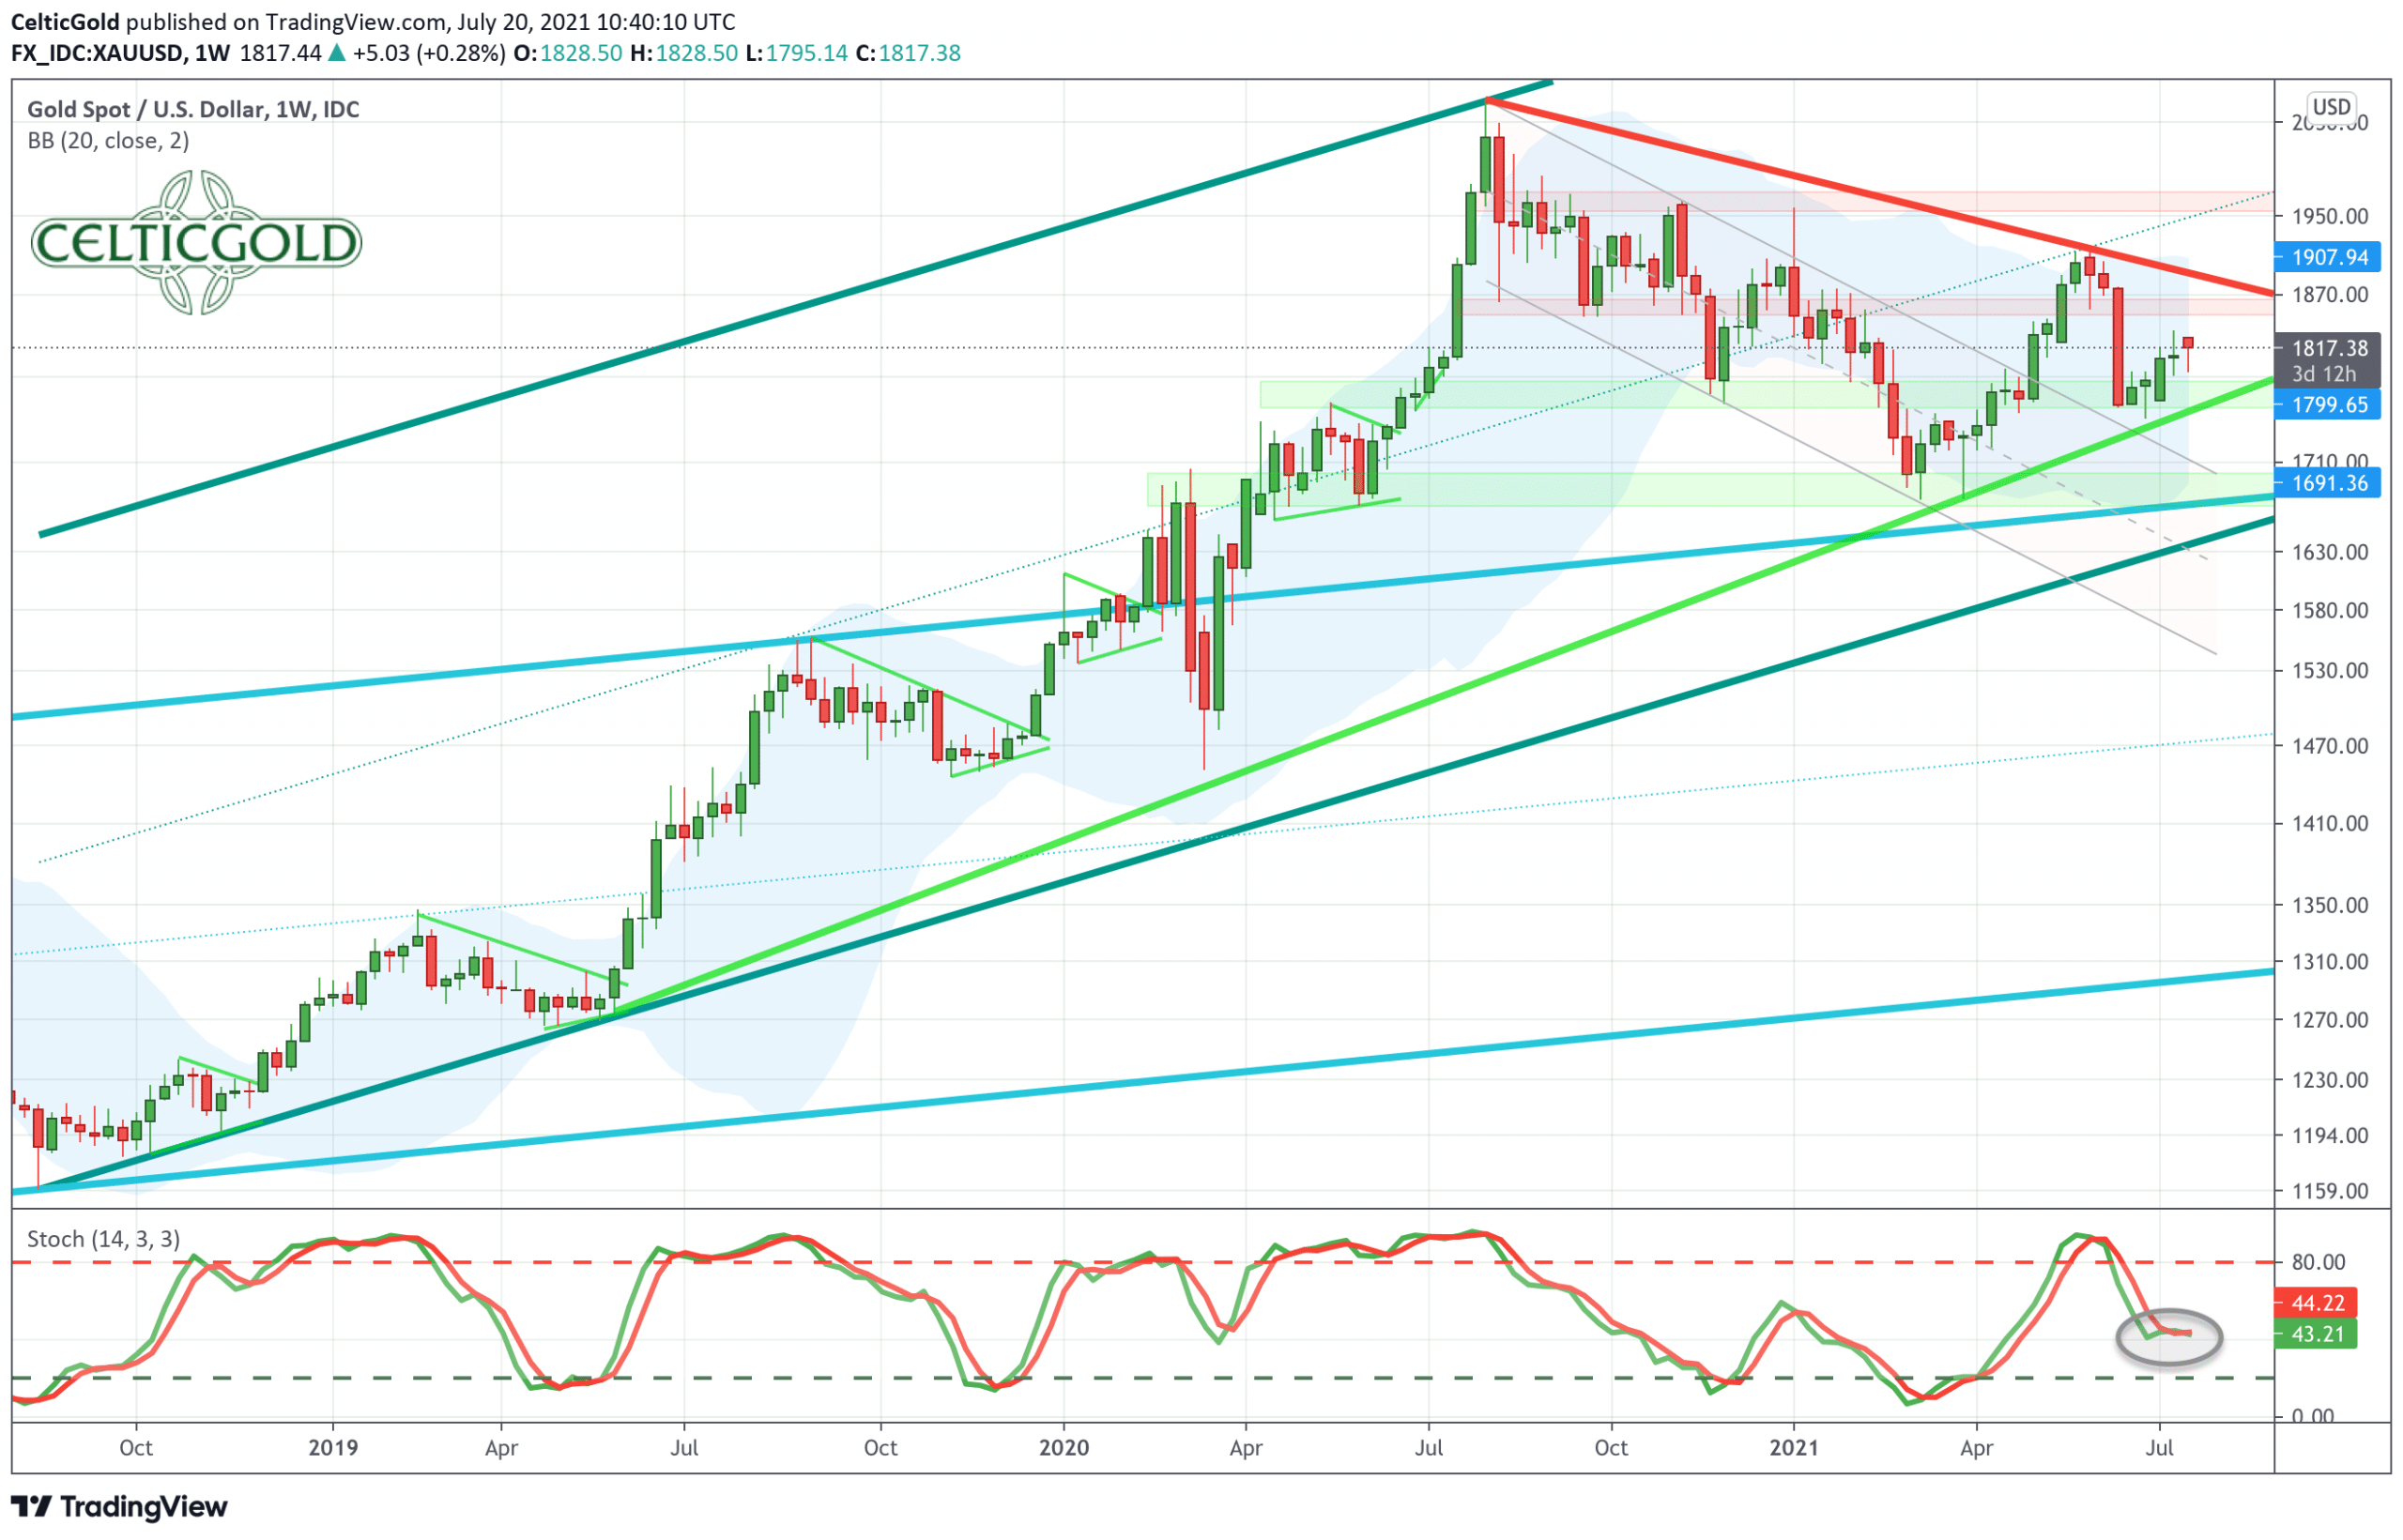
Gold in US-Dollars, weekly chart as of July 20th, 2021. Source: Tradingview
On the weekly chart, gold has been moving higher within a clearly defined uptrend channel (dark green) since autumn 2018. The lower edge of this trend channel was tested in April 2019. The sharp pullback in June, on the other hand, has so far ended at US$1,750 and thus at the connecting line (light green) of the last three higher lows. At the same time, the upper edge of the former downward trend channel (red) was successfully tested for support.
If the correction is now over, gold could already be on the way to its upper Bollinger Band (US$1,911). In any case, the stochastic has turned upwards again and thus provides a new buy signal.
Overall, the weekly chart is not (yet) convincing, but the bullish tendencies prevail. To confirm the uptrend, a higher high is needed in the next step, which would require gold prices above US$1,916. Until then, however, the bulls still have a lot of work to do. If, on the other hand, the low at US$1,750 is being taken out, another retracement towards the lower edge of the uptrend channel at around US$1,670 to US$1,700 is very likely.
Daily Chart – Around the falling 200-day moving average
(Click on image to enlarge)
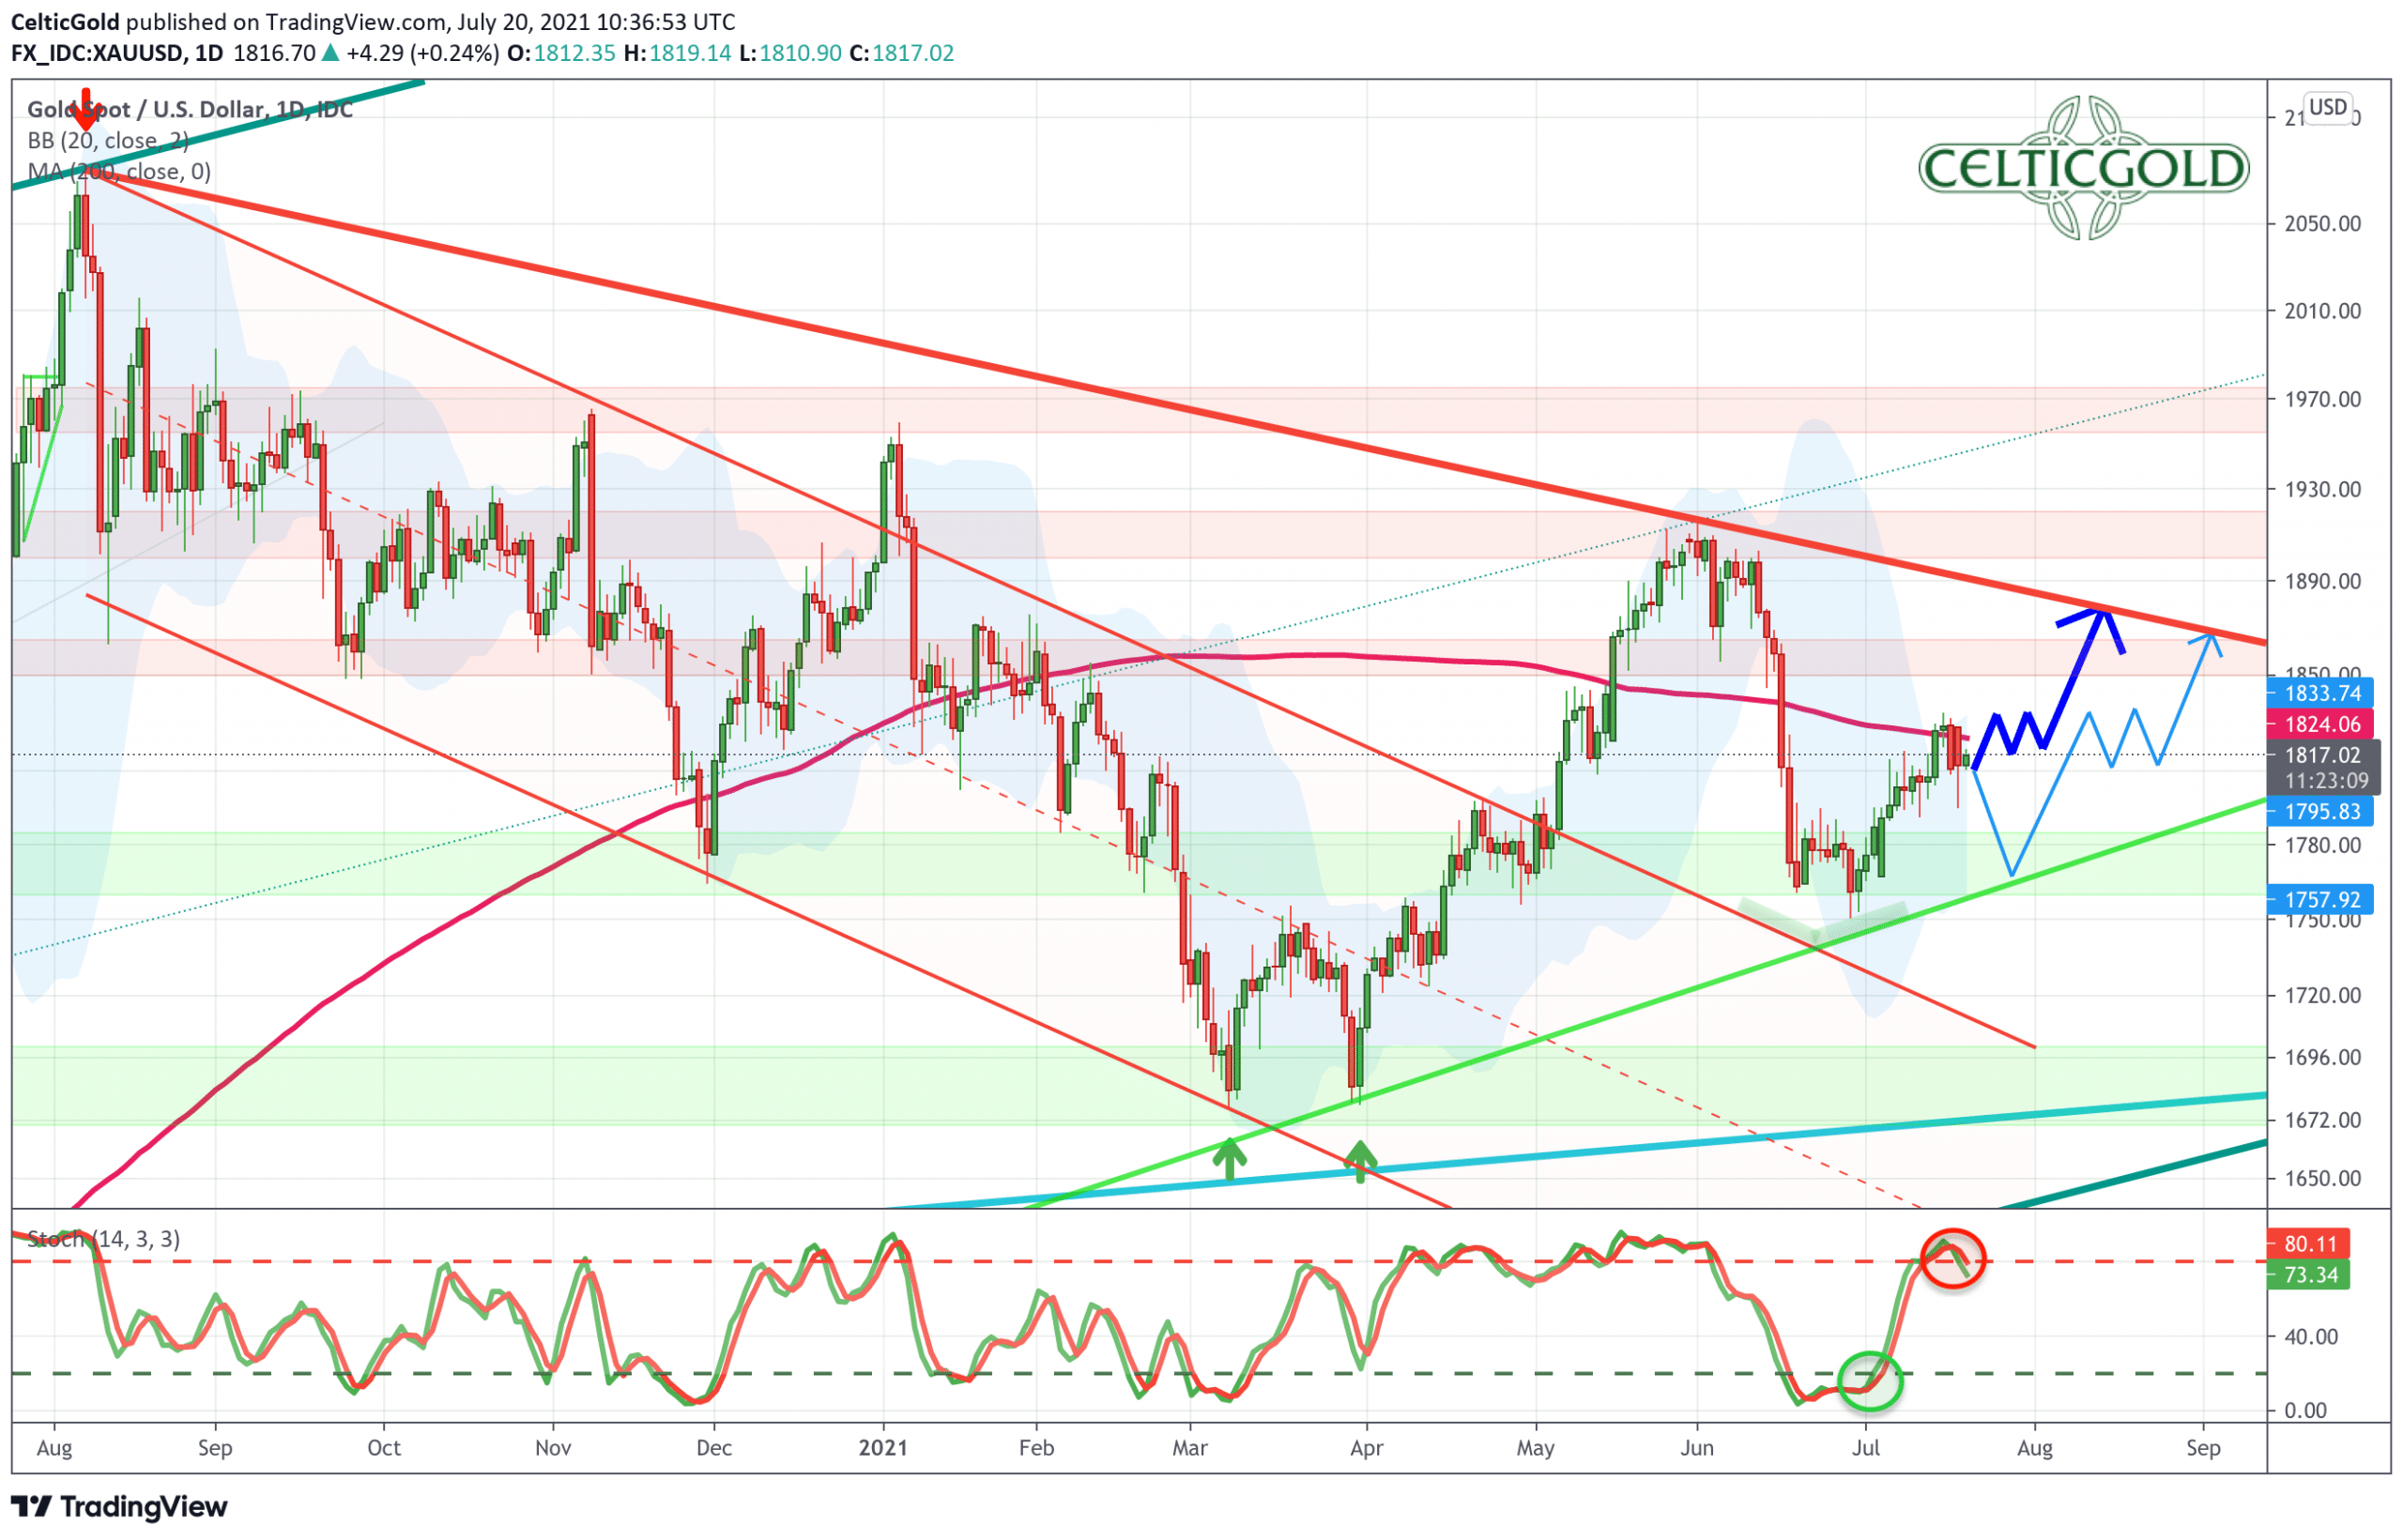
Gold in US-Dollars, daily chart as of July 20th, 2021. Source: Tradingview
On the daily chart, gold had good support at the cross of a downtrend and an uptrend line. Starting from that zone and the low at US$1,750, gold did already recover slightly above the still falling 200-day moving average (US$1,824). However, as the stochastic oscillator has already moved into the overbought zone and created a new sell signal. As well, the upper Bollinger Band (US$ 1,831) is blocking the bulls. Hence, a consolidation around the 200-day moving average would be a highly conceivable scenario.
Bulls need to gain confidence again
Once the important 200-day moving average will have been sustainably recaptured and the bulls will have gained some confidence, the rally could continue and transform into the typical summer rally. The next target would then be the downward trend line from the all-time high via the high from the end of May. This line is currently sitting at around US$1,892 and is falling a few dollars a day.
In summary, the daily chart is overbought in the short term. This means that the risk/reward ratio is not good right now. Ideally, however, the bulls will succeed in consolidating around the200-day moving average for at least a few days or even several weeks. This would provide the launching pad for the summer rally and higher gold prices. If, on the other hand, prices fall below US$1,790 again, the correction will likely continue. However, only below US$1,765 the promising setup for a midsummer rally would be destroyed.
Commitments of Traders for Gold – Has the summer rally already begun?
(Click on image to enlarge)
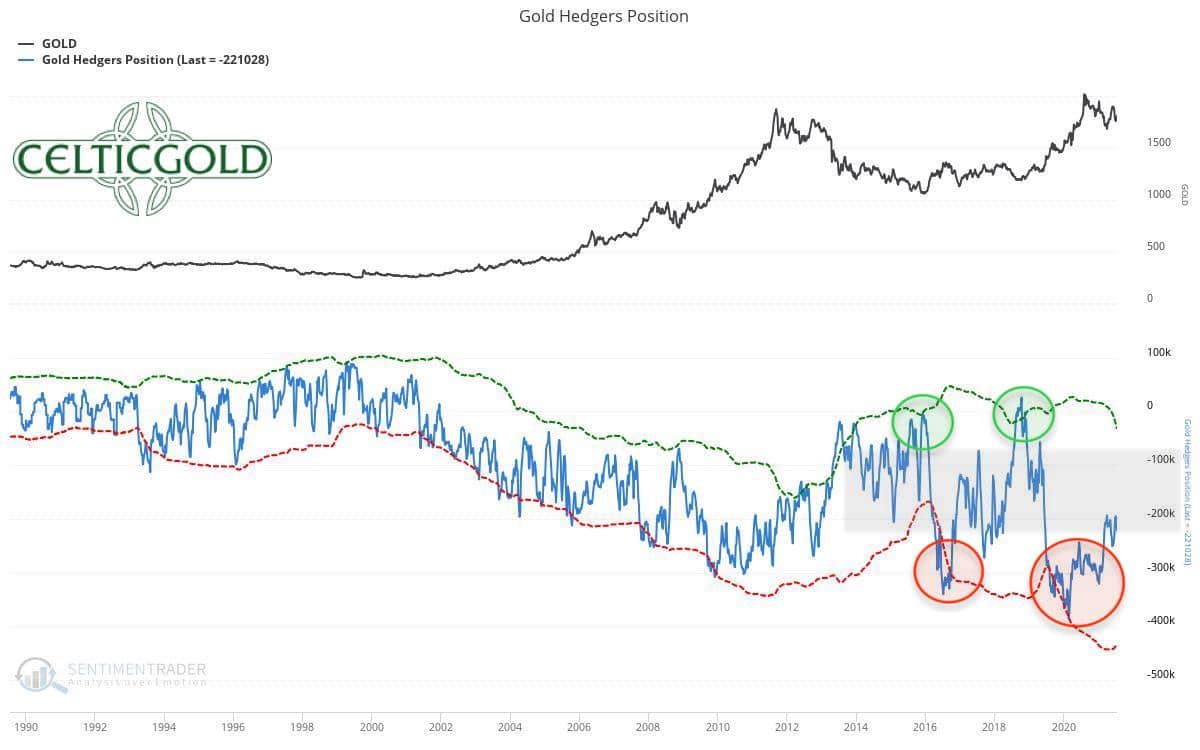
Commitments of Traders for Gold as of July 19th, 2021. Source: Sentimentrader
The commercial traders used the sharp pullback in June to cover their short positions again. This has eased the setup in the futures market somewhat. Nevertheless, with 221.028 contracts sold short as of last Tuesday, commercial traders still hold a relatively high short position on the gold future in a longer-term comparison.
In summary, the current Commitment of Trades report (CoT) still does not provide a contrarian buy signal but calls for caution and patience.
Sentiment for Gold – Has the summer rally already begun?
(Click on image to enlarge)
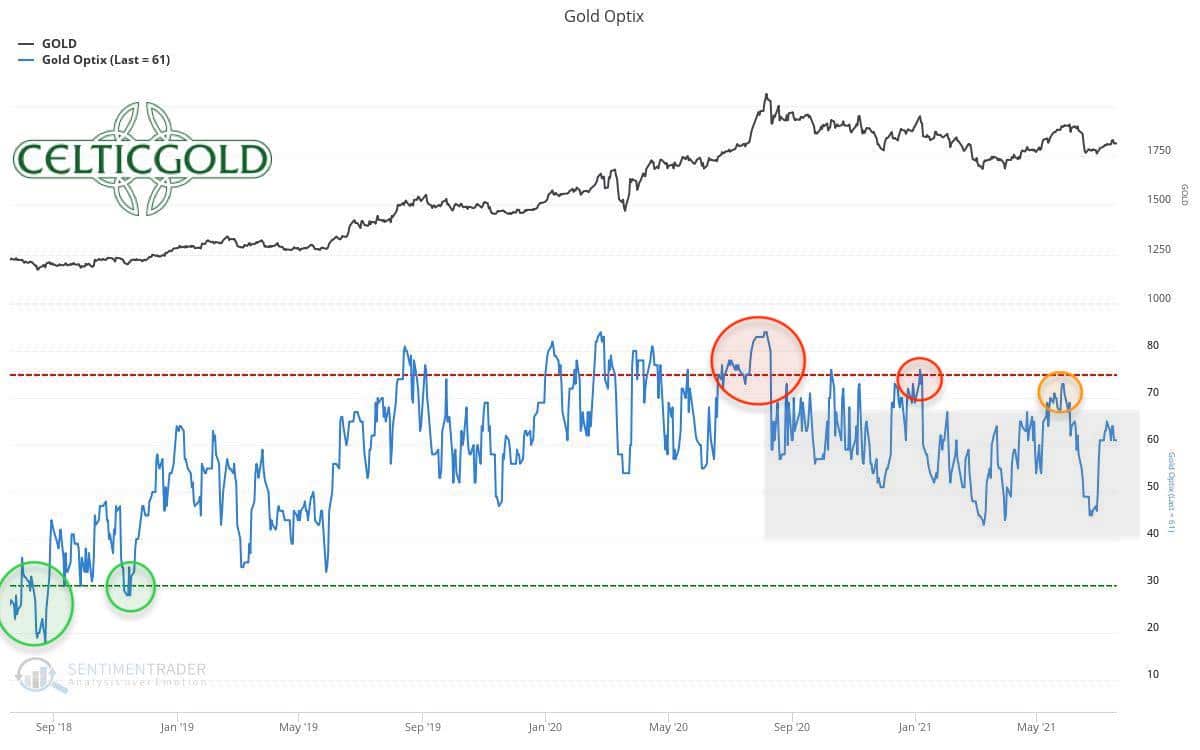
Sentiment Optix for Gold as of July 19th, 2021. Source: Sentimentrader
The Sentiment in the gold market fell to a low at the end of June and has since recovered quite a bit. However, this low did not represent an extreme but rather showed only a slight increase in pessimism. The last “real” panic low in the gold market, on the other hand, was last seen in August 2018 with the sell-off at that time down to US$1,160. No one can predict when and if such a good contrarian opportunity will arise again in this bull market. It remains to be said that the correction in June did not lead to any extreme pessimism, and that confidence has already prevailed again.
The sentiment thus tends to reinforce the doubts about a sustainable and imminent wave up.
Seasonality for Gold – Has the summer rally already begun?
(Click on image to enlarge)

Seasonality for Gold over the last 53-years as of July 14th, 2021. Source: Sentimentrader
A strong green light, on the other hand, currently comes from the seasonal component! Statistically, a major bull move in the gold market begins precisely in these days. This wave up usually lasts until the end of September or even mid-October. Although the price action of the last three weeks left the impression of an early summer doldrums, it is precisely this price behavior that fits the seasonal pattern.
Hence, as soon as the gold market will start to move, the chances of a strong movement up are very favorable from a seasonal perspective.
Sound Money: Bitcoin/Gold-Ratio
(Click on image to enlarge)
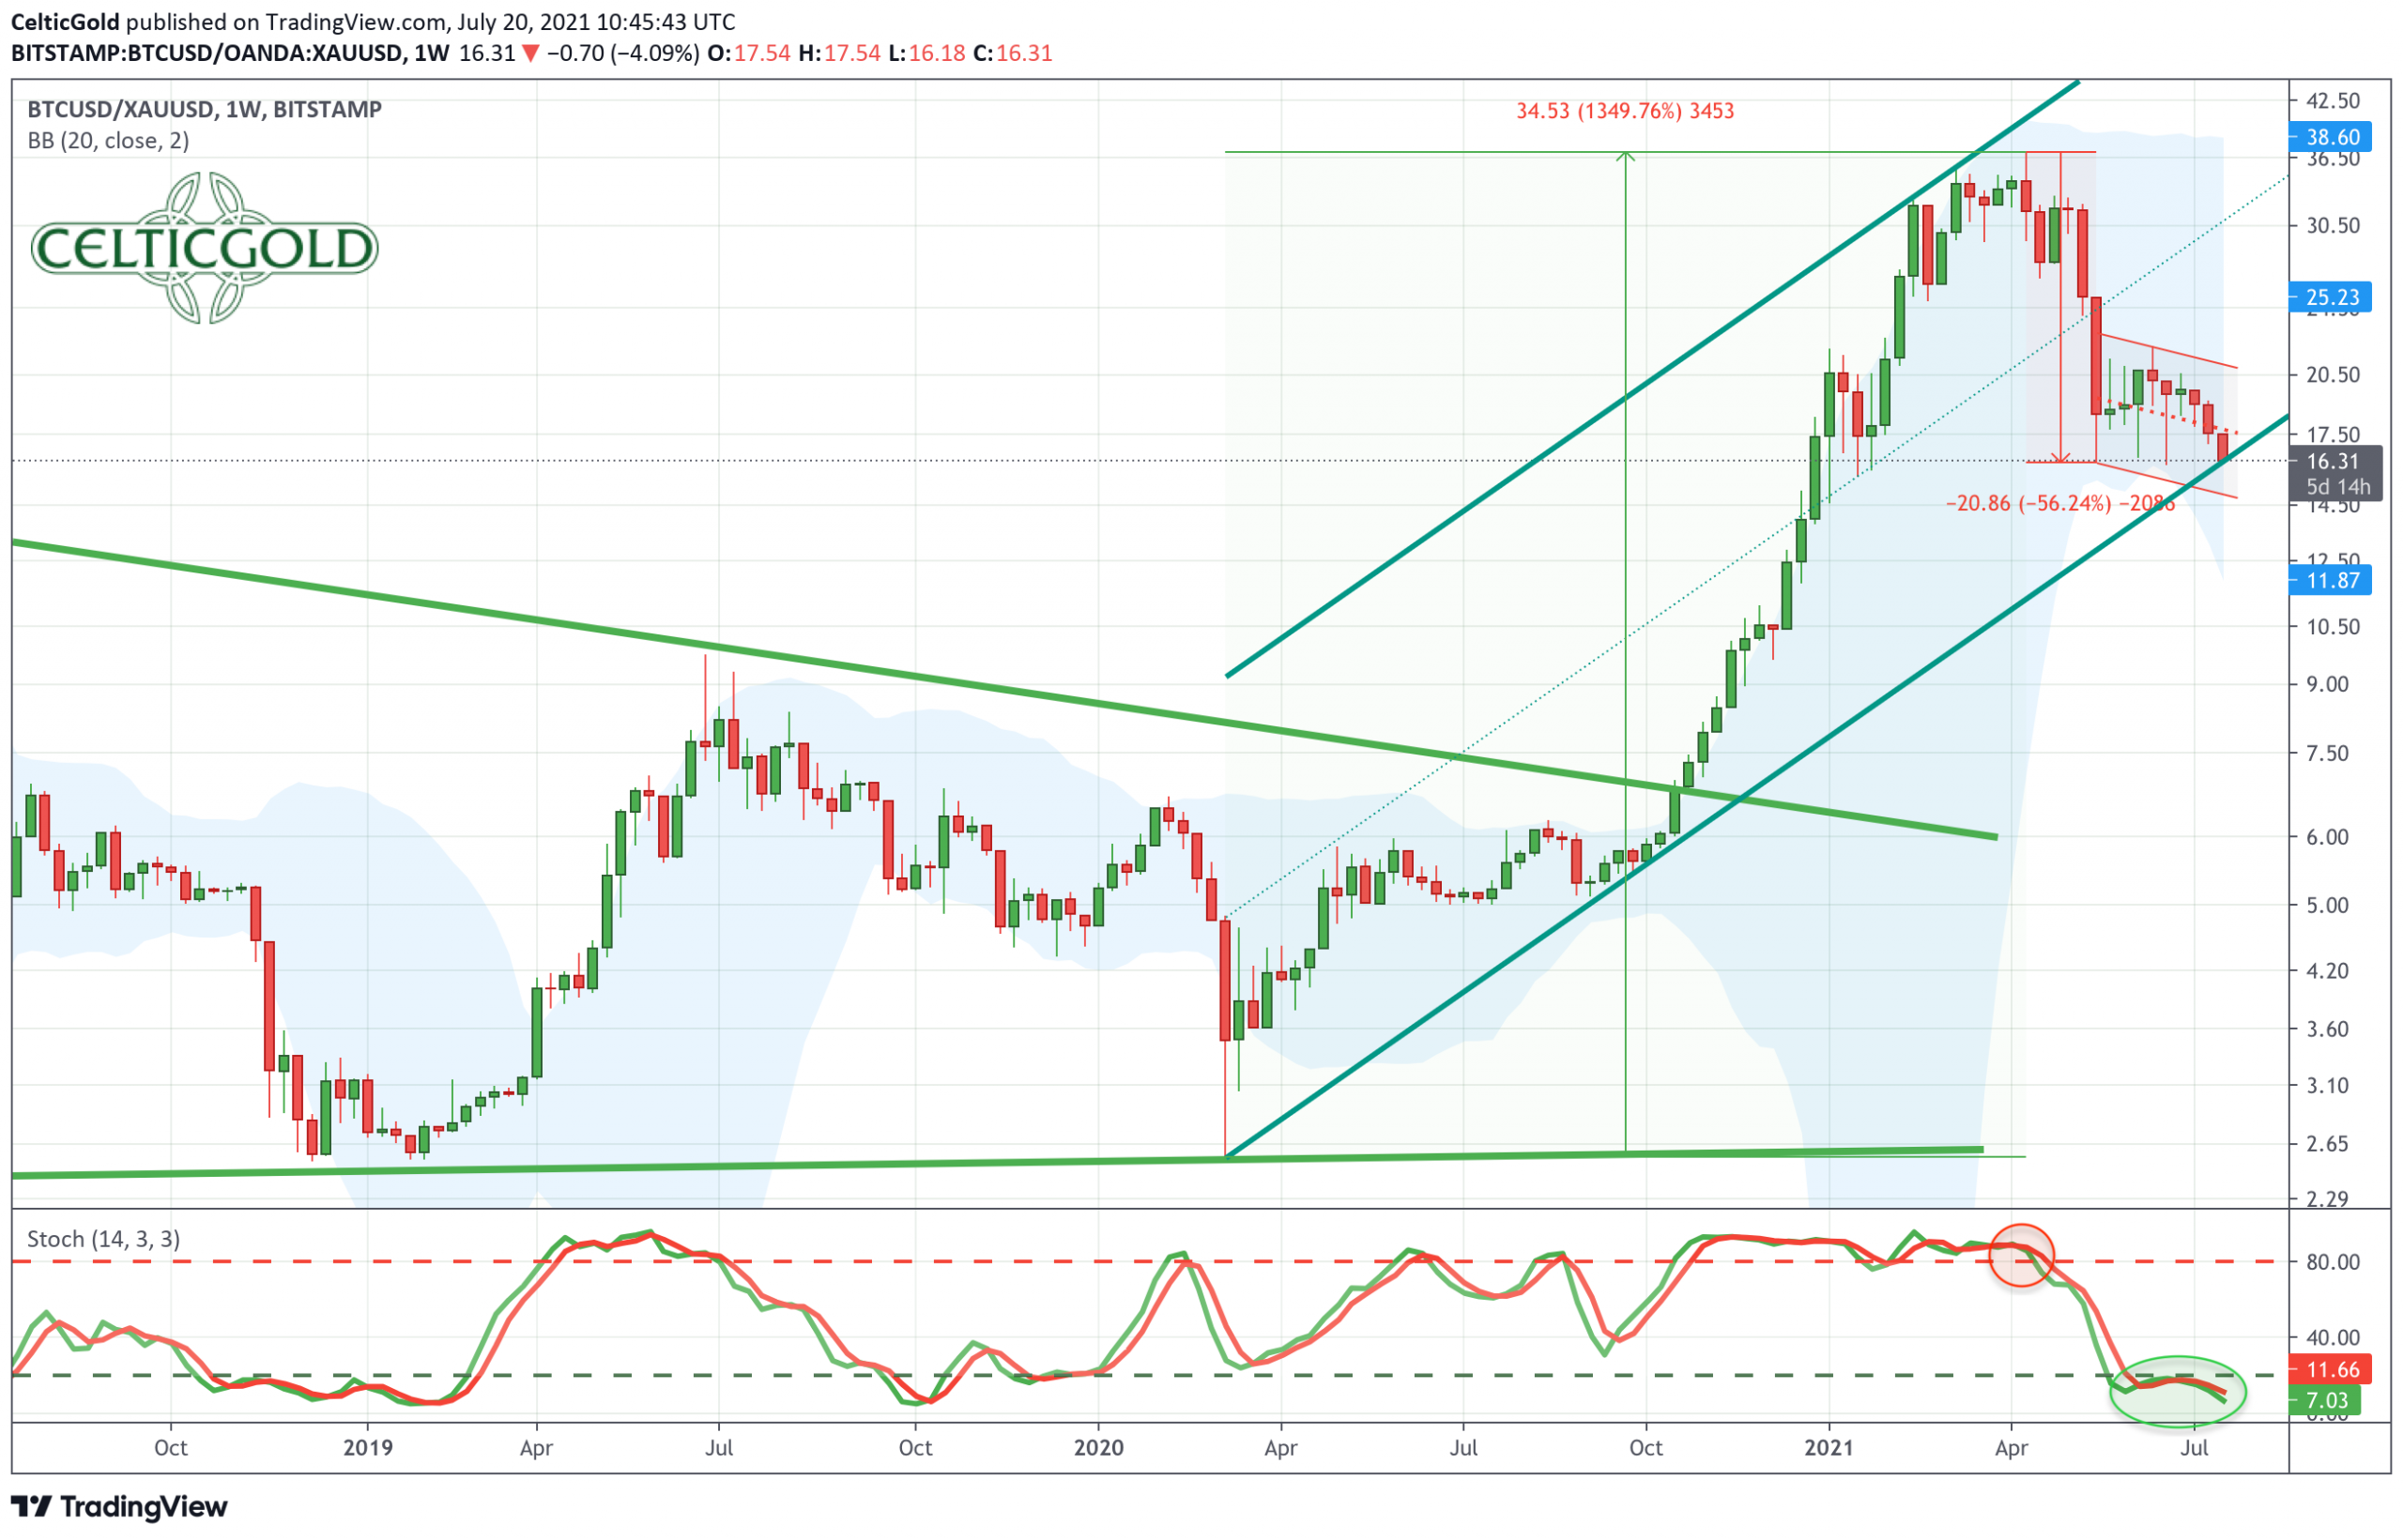
Bitcoin/Gold-Ratio as of July 20th, 2021. Source: Tradingview
With prices of around US$29,500 for one bitcoin and US$1,815 for one troy ounce of gold, the Bitcoin/Gold-ratio is currently around 16.25. This means that you currently must pay a bit more than 16 ounces of gold for one bitcoin. Conversely, one ounce of gold currently costs 0.0615 bitcoin. Since the sharp sell off at the beginning of May, the bitcoin/gold ratio has mainly been running sideways. Another price slide does not seem out of the question given the continued weakness of bitcoin. However, the long-term uptrend in favor of bitcoin remains intact, while the stochastic on the ratio chart is heavily oversold.
You want to own Bitcoin and gold!
Generally, buying and selling Bitcoin against gold only makes sense to the extent that one balances the allocation in those two asset classes! At least 10% but better 25% of one’s total assets should be invested in precious metals physically, while in cryptos and especially in bitcoin one should hold at least between 1% and 5%. If you are very familiar with cryptocurrencies and bitcoin, you can certainly allocate much higher percentages to bitcoin on an individual basis. For the average investor, who is primarily invested in equities and real estate, 5% in the still highly speculative and highly volatile bitcoin is a good guideline!
Overall, you want to own gold as well as bitcoin since opposites complement each other. In our dualistic world of Yin and Yang, body and mind, up and down, warm and cold, we are bound by the necessary attraction of opposites. In this sense you can view gold and bitcoin as such a pair of strength. With the physical component of gold and the pristine digital features of bitcoin you have a complementary unit of a true safe haven for the 21st century. You want to own both! – Florian Grummes
Macro update and Crack-up-Boom:
(Click on image to enlarge)
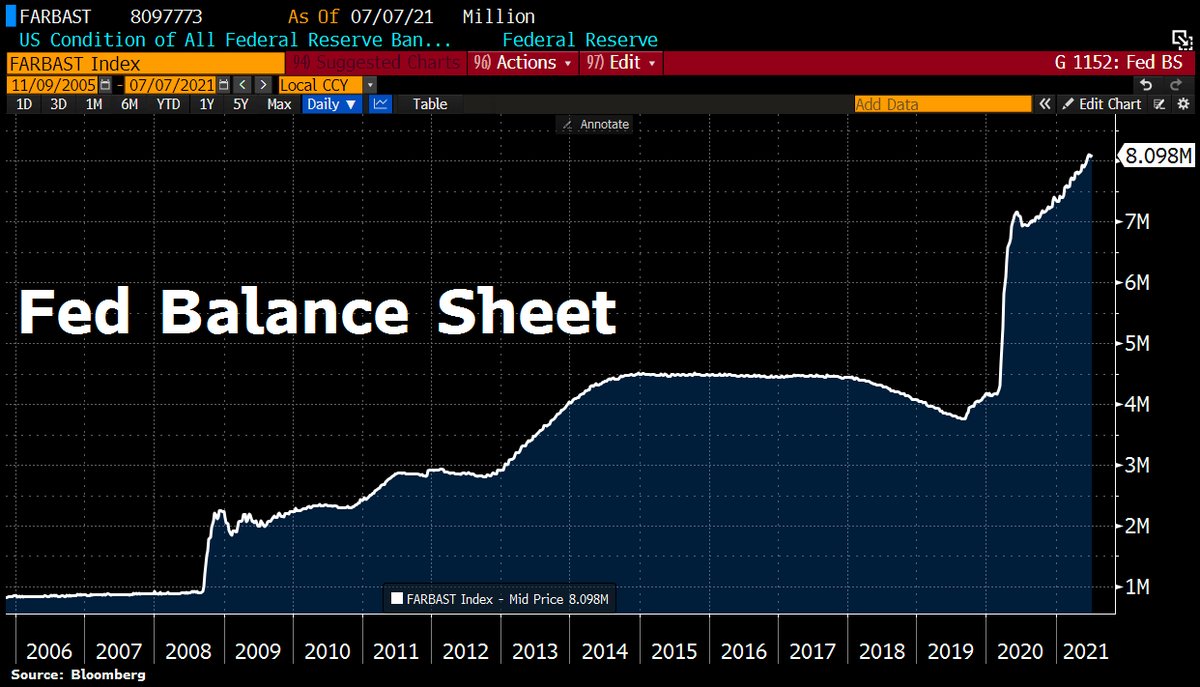
FED Balance sheet as of July 10th, 2021. Source Holger Zschaepitz
In terms of monetary expansion, the global uptrend continued in recent weeks, of course. The balance sheet of the US Federal Reserve grew by US$19 billion to a total of US$ 8,097.8 billion and thus once again reached a new all-time high. The Fed’s balance sheet total is now equivalent to 37% of the GDP in the USA.
(Click on image to enlarge)

ECB Balance sheet as of July 13th, 2021. Source Holger Zschaepitz
The ECB’s balance sheet rose by another EUR 18.7 billion last week to a new all-time high of EUR 7,926.6 billion. With this, the ECB also created new billions out of thin air, as it does every week, completely irrespective of which of its various goals (symmetric or average price target, pandemic emergency purchase program PEPP or quantitative easing) is currently supposedly being pursued.
(Click on image to enlarge)
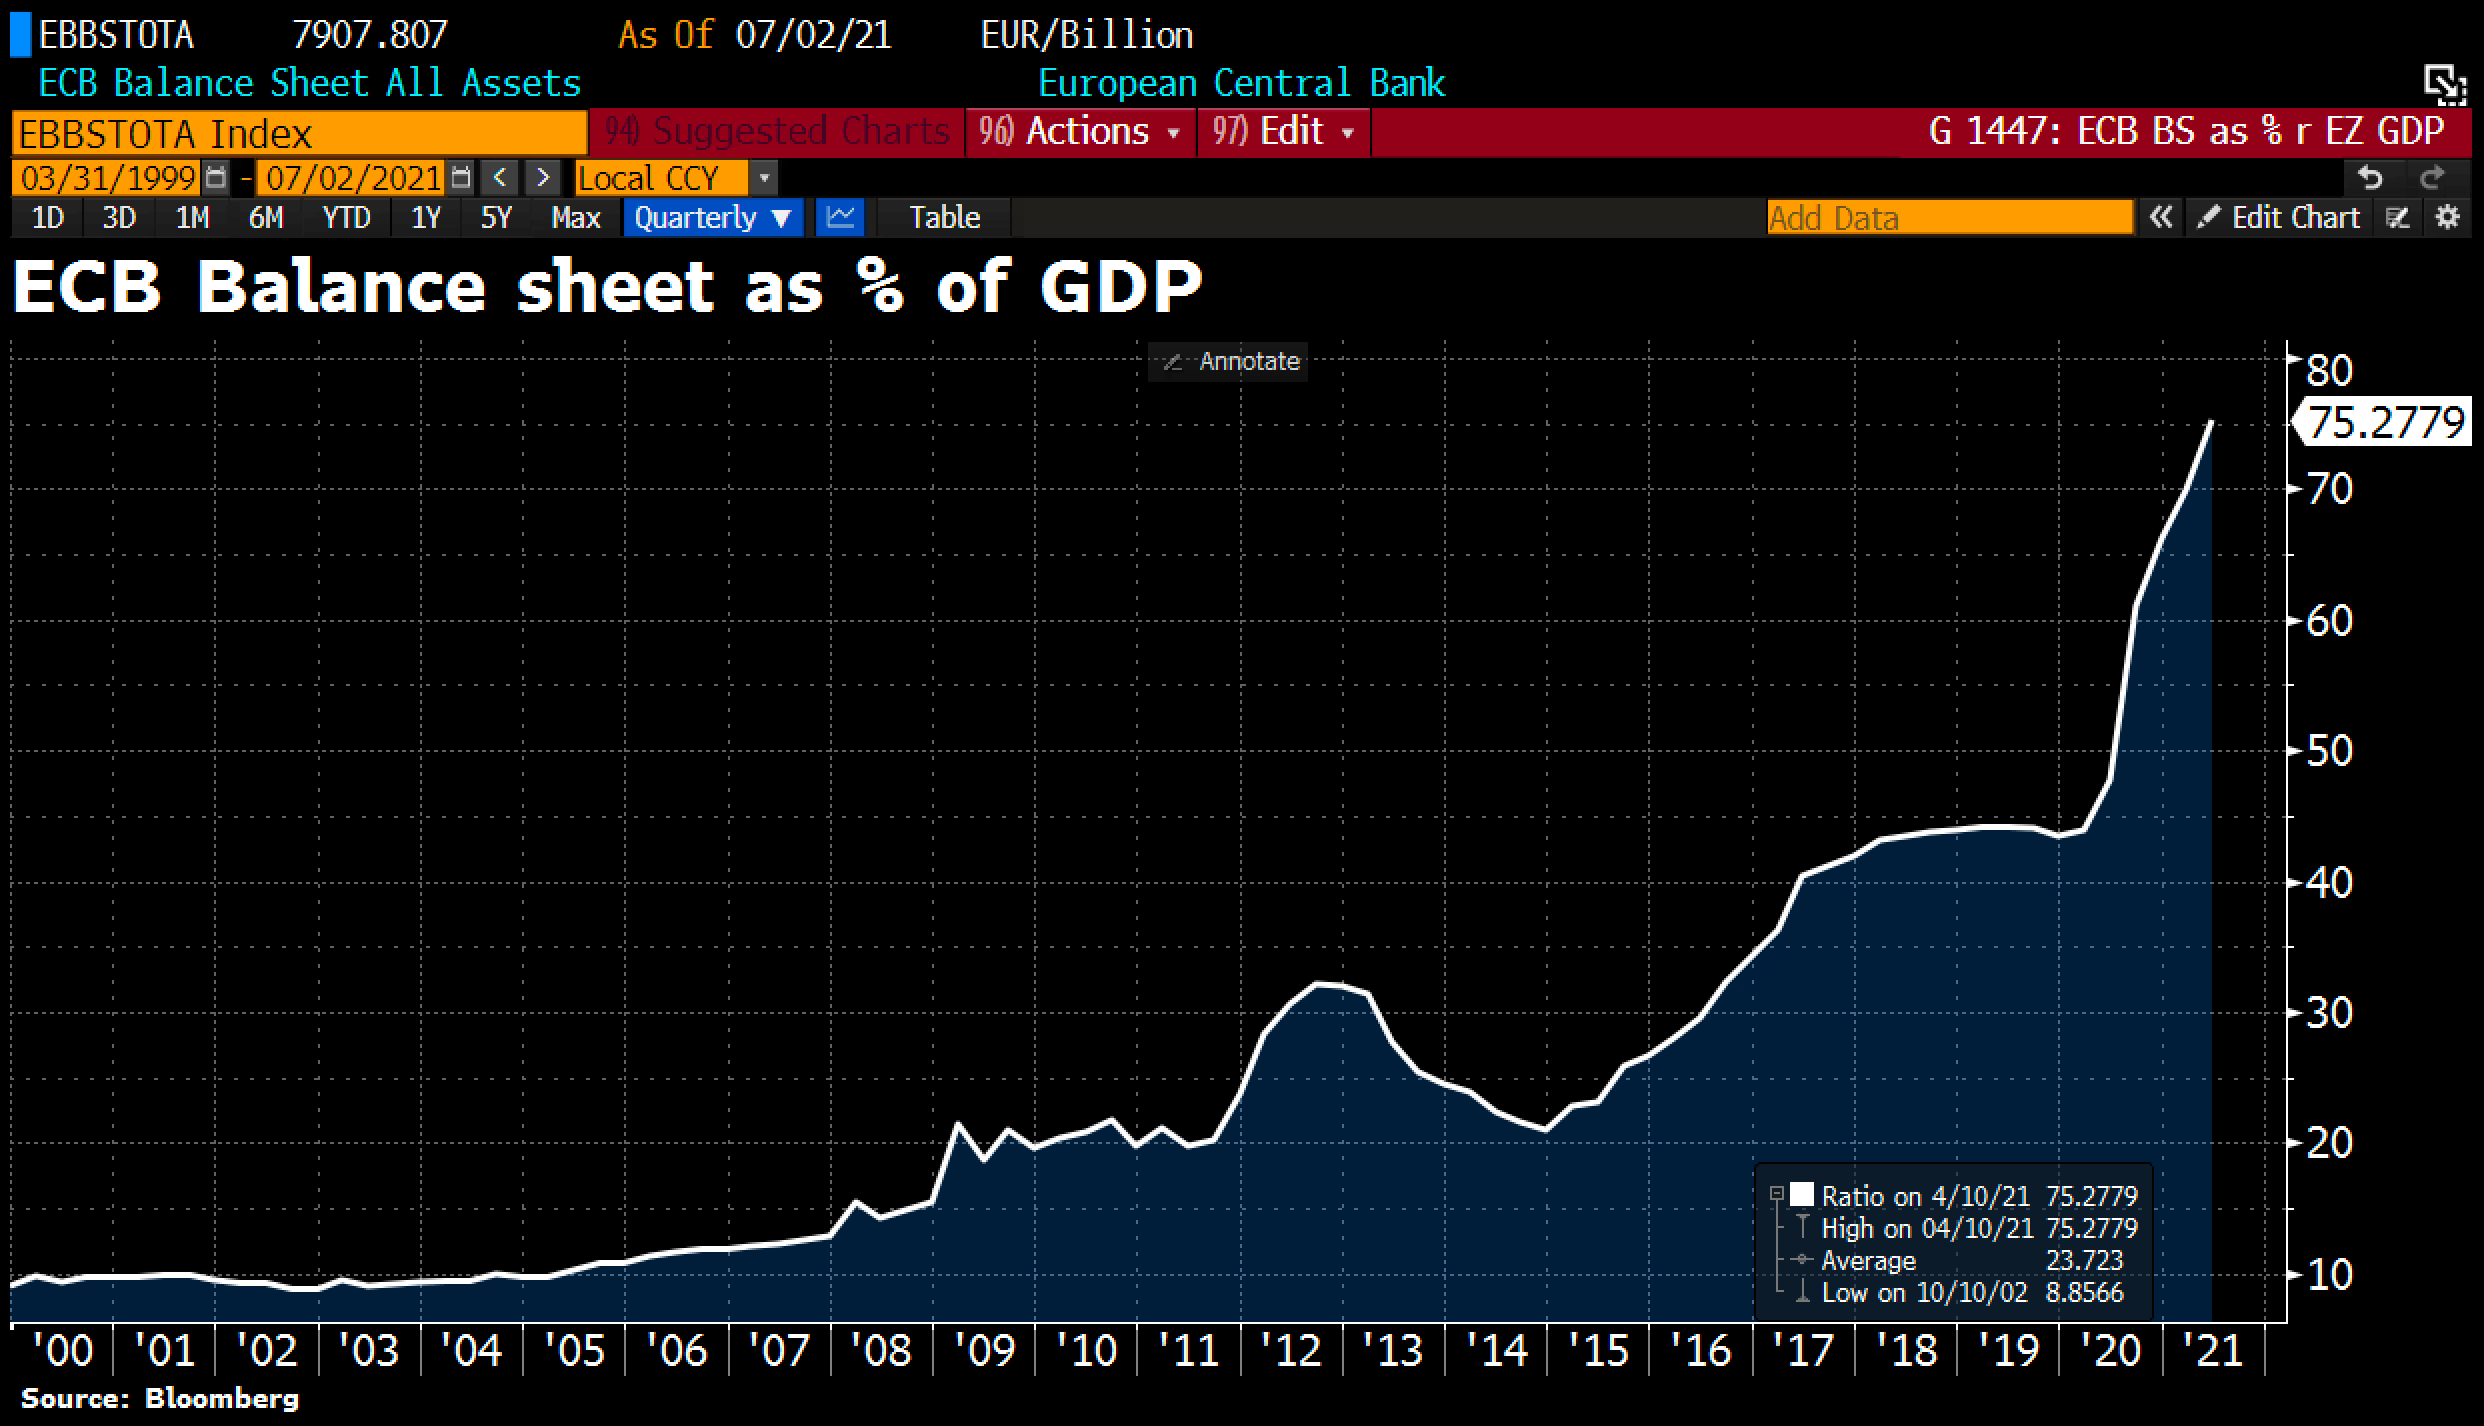
ECB Balance sheet in percentage of Eurozone GDP as of July 10th, 2021. Source Holger Zschaepitz
The ECB’s balance sheet total is now equivalent to over 75% of the GDP of the entire Eurozone, reflecting the ECB’s huge increase in power. The central bank has long since been unable to concentrate on its actual goal of price stability. Instead, it has taken on too many other tasks in the ECB Tower in Frankfurt. And these fiscal and monetary interventions are becoming increasingly vertical.
Central banks are destroying the free market

Digital Euro as of Jul 14, 2021. Source: European Central Bank
However, printing money has never worked in the history of mankind. It will not work this time either. The question remains how long the music will continue to play for the dance on the volcano, and whether it will still be possible in time to finally and completely eliminate the free markets with a new digital EUR currency.
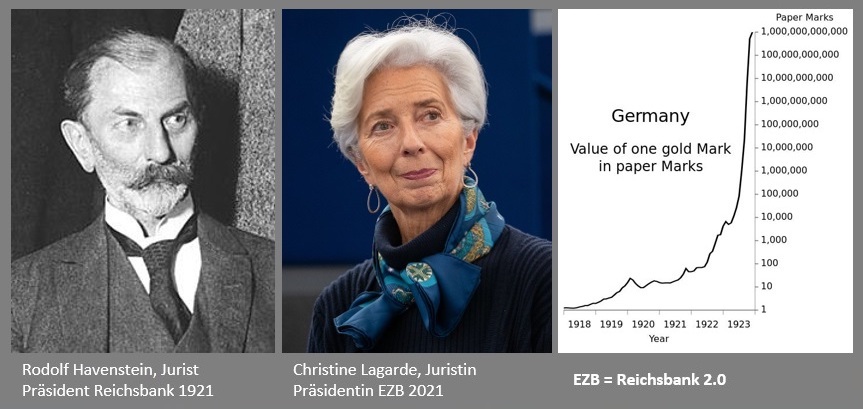
ECB = Reichsbank 2.0 as of July 8th, 2021. ©Stefan Schmidt
In the end, Madame Lagarde, just like Rudolf Havenstein, is a prisoner of the absurd financial policy that has maneuvered itself into a dead end thanks to an unbacked paper money system. Havenstein, by the way, was also an inflationist and, until his death in November 1923, interpreted the Weimar hyperinflation as a product of the unfavorable balance of payments and did not get the idea that it had come about through the unbridled use of the printing press.
Conclusion: Gold – Has the summer rally already begun?
After the sharp pullback in June and an initially tenacious bottoming phase, gold recovered towards US$ 1,834 in the last two weeks. Even though this rally took quite some effort, gold makes the impression that there is more upside to come. Actually, the summer rally has probably already started. After a temporary consolidation around the 200-day moving average, August should bring significantly higher gold prices (US$1,865 and US$1,910). Short-term pullbacks towards and below US$1,800 are therefore buying opportunities.
However, the performance of the mining stocks does not quite fit into this optimistic picture. The GDX (VanEck Gold Miners ETF) is currently trading well below its 200-day moving average. And heavyweights such as Newmont Corporation and Barrick Gold have not been able to get back on their feet at all since the sell-off in mid-June. Despite this weakness in gold mining stocks, the call for a summer rally in the sector will have to be canceled if gold moves back below US$1,765.
Analysis initially written on July 15th and published on July 19th, 2021, by more


Don't think so.