Fed Hawks Circle Over Gold. Will It Become Their Prey?
The imminent interest rate hike by the Fed is almost certain. Are investors' concerns justified and will it mean trouble for the precious metals?
While the S&P 500 and the Nasdaq Composite recovered from sharp intraday losses on Jan. 10, investors’ mood swings signaled heightened anxiety. With the PMs whipsawing alongside the general stock market, more volatility should materialize in the weeks and months to come.
To explain, with the Fed on a hawkish warpath to fight rampant inflation, JPMorgan CEO Jamie Dimon told CNBC on Jan. 10 that a resilient U.S. economy could prove problematic for the financial markets in 2022.
“The consumer balance sheet has never been in better shape; they’re spending 25% more today than pre-COVID,” said Dimon. “Their debt-service ratio is better than it’s been since we’ve been keeping records for 50 years.”
As for inflation and the Fed:
“It’s possible that inflation is worse than they think and they raise rates more than people think. I personally would be surprised if it’s just four [interest rate] increases [in 2022],” he added.
How would the financial markets react?
Source: CNBC
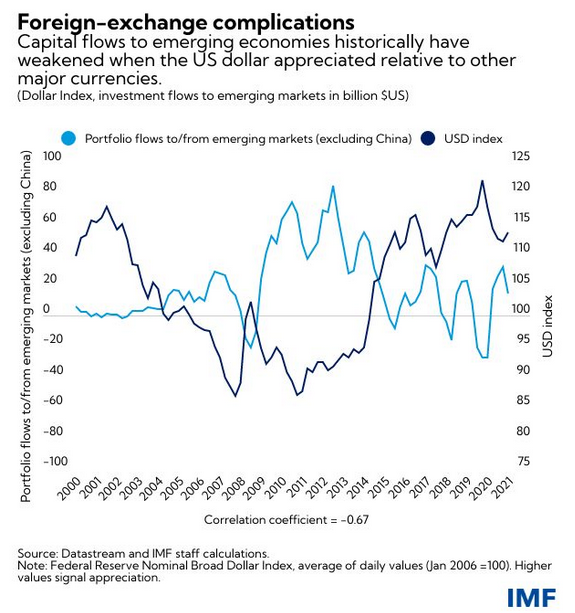
Singing a similar tune, the International Monetary Fund (IMF) warned on Jan. 10 that the Fed’s rate hike cycle could slaughter emerging markets. Its report revealed:
“For most of last year, investors priced in a temporary rise in inflation in the United States given the unsteady economic recovery and a slow unraveling of supply bottlenecks. Now sentiment has shifted. Prices are rising at the fastest pace in almost four decades and the tight labor market has started to feed into wage increases.”
Volatile Days Ahead
While I warned for all of 2021 that inflationary pressures were bullish for the U.S. dollar and U.S. Treasury yields and bearish for the PMs, the IMF stated:
“Faster Fed rate increases in response could rattle financial markets and tighten financial conditions globally. These developments could come with a slowing of US demand and trade and may lead to capital outflows and currency depreciation in emerging markets.”
As a result, even the IMF is anxiously bullish on the USD Index:
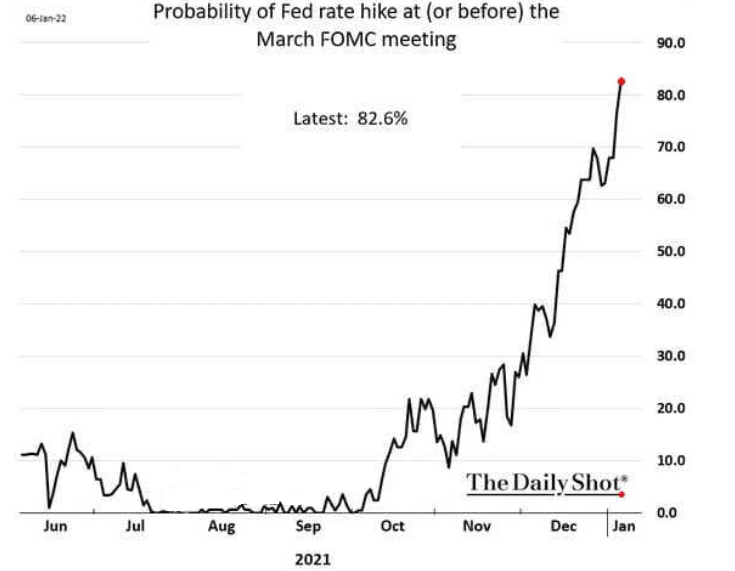
For a good reason. With September, July, June, and May all gone by the wayside, now, the market-implied probability of a Fed rate hike in March has risen to nearly 83%. For context, the probability of a March liftoff was less than 10% in early November.
Please see below:
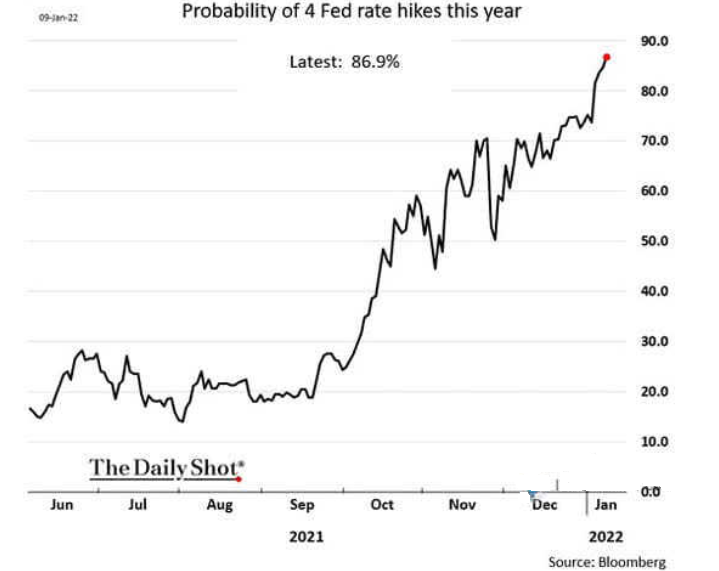
Likewise, the market-implied probability of four rate hikes by the Fed in 2022 has risen to nearly 87%. Again, the probability was less than 50% in early November.
Please see below:
Why the material shift? Well, while I’ve been warning for months that rampant inflation would elicit a hawkish about-face from the Fed, investors are finally coming around to this reality. With inflation still running hot, market participants understand that pricing pressures won’t subside without policy responses from the Fed. As a result, the “transitory” narrative is dead, and investors have lost one of their staunchest allies. This means that predicting silver and gold at higher levels in the medium term might not be the best idea.
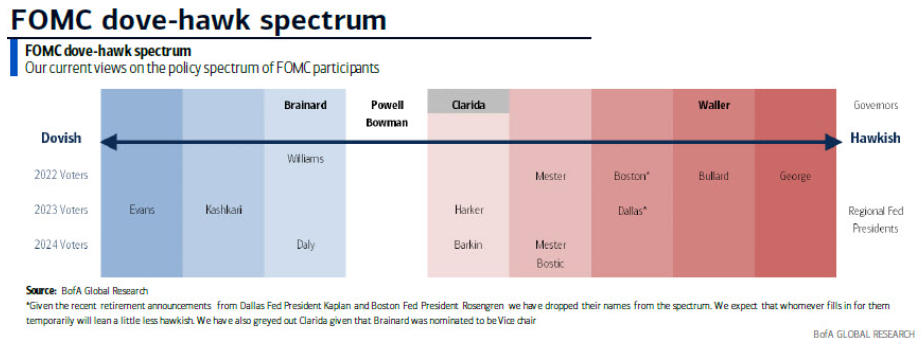
To that point, Bank of America’s dove-hawk spectrum shows that the dovish brigade has lost several soldiers. With the hawks now on the offensive, the officials preaching monetary patience are few and far between.
Please see below:
(Click on image to enlarge)
For context, Bank of America still places San Francisco Fed President Mary Daly in the dovish bucket. However, I noted on Dec. 23 that she has materially shifted her stance in recent weeks:
Source: The New York Times
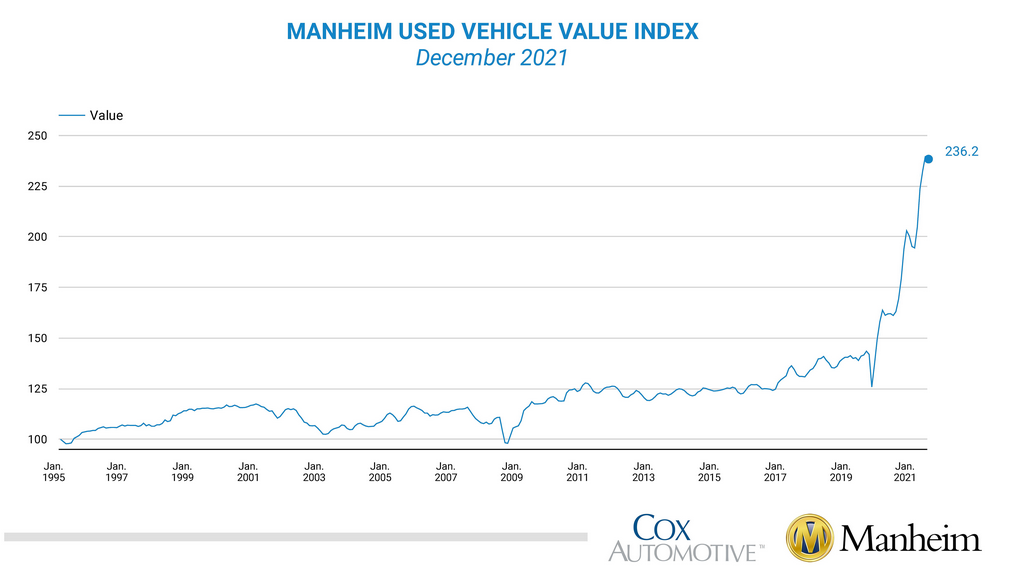
Furthermore, with inflationary pressures still bubbling, the Manheim Used Vehicle Value Index hit another all-time high of 236.2 in December, as “wholesale used vehicle prices (on a mix-, mileage-, and seasonally adjusted basis) increased 1.6% month-over-month.”
Please see below:
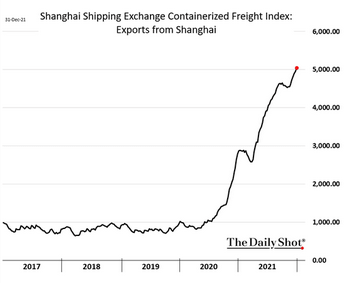
On top of that, the cost of shipping from Shanghai, China, is still increasing. With the U.S. importing more goods from China than any other nation, the inflationary impact on the U.S. economy is material.
Please see below:
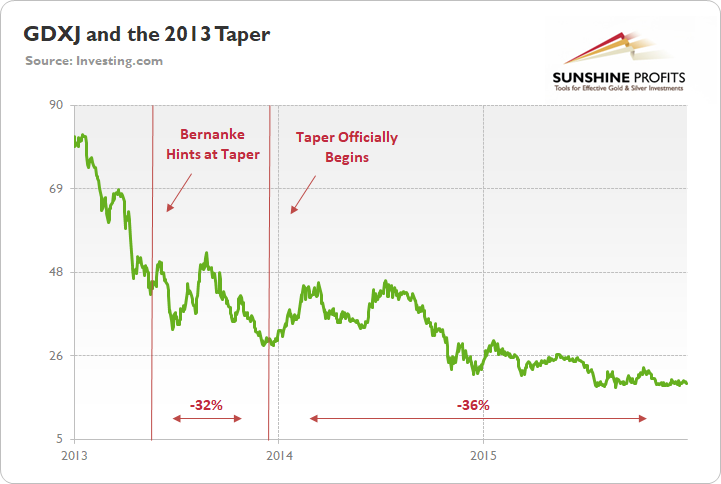
Finally, while the GDXJ ETF benefited from the Nasdaq Composite’s intraday reversal on Jan. 10, I warned on Oct. 26 that monetary policy tightening would eventually upend the junior miners. I wrote:
To explain, the green line above tracks the GDXJ ETF from the beginning of 2013 to the end of 2015. If you analyze the left side of the chart, you can see that when Fed Chairman Ben Bernanke hinted at tapering on May 22, 2013, the GDXJ ETF declined by 32% from May 22 until the taper began on Dec. 18.
Moreover, the onslaught didn’t end there. Once the taper officially began, the GDXJ ETF enjoyed a relief rally (similar to what we’re witnessing now), as long-term interest rates declined and the PMs assumed that the worst was in the rearview.
However, as the liquidity drain caught up to the junior miners over the medium term, the GDXJ ETF declined by another 36% from when the taper was announced on Dec. 18, 2013 until the end of 2015.
To that point, with part one already on the books, the second act will likely unfold once the Fed formally begins its taper in “either mid-November or mid-December.” Thus, history implies that the GDXJ ETF still has plenty of downside left.
While the junior miners' ETF has declined by more than 11% since Oct. 26, Goldman Sachs has come around to our way of thinking.
Please see below:
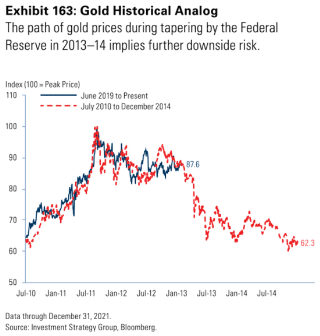
To explain, Goldman Sachs told its clients last week that the yellow metal has been following its ominous path since 2013/2014 (as you may recall, I’ve been writing about the 2013-now analogy for months). For context, the red line above tracks gold’s price action from July 2010 until December 2014, while the blue line above tracks gold’s price action from July 2019 until now.
If you analyze the symmetrical overlay, you can see that the pair have been in sync for some time. Moreover, if you focus your attention on the red line’s plight as time passes, it’s clear why Goldman Sachs is warning its clients about “further downside risk”.
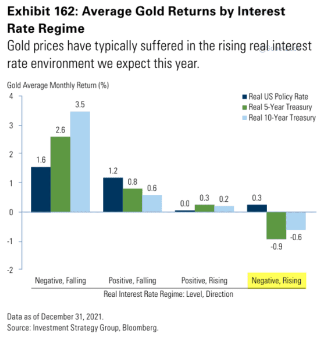
To that point, with the investment bank forecasting a real (inflation-adjusted) interest rate regime change in 2022, gold is poised to suffer along the way.
To explain, the various bars above track gold’s monthly returns when the real U.S. Federal Funds Rate (dark blue), the real U.S. 5-Year Treasury yield (green), and the real U.S. 10-Year Treasury yield (light blue) begin with positive/negative values and then increase/decrease.
If you focus your attention on the bars furthest to the right, you can see that when the real U.S. 5-Year Treasury yield and the real U.S. 10-Year Treasury yield are negative and then rise, gold suffers its worst monthly performances. Moreover, with the current fundamental environment presenting us with precisely that, similar results will likely materialize over the medium term.
The bottom line? While investors desperately bought the dip on Jan. 10, the more than 2% intraday swing in the Nasdaq Composite screamed of monetary policy anxiety. With another hot inflation print poised to hit the wire on Jan. 12, the reprieve will likely be short-lived. Furthermore, with the PMs suffering from a similar fundamental affliction – as both the PMs and technology stocks are extremely allergic to rising interest rates – volatility is likely here to stay. As a result, the Fed should continue to break investors’ hearts over the medium term.
In conclusion, the PMs rallied on Jan. 10, though their fundamental outlooks remain profoundly bearish. With interest rates poised to rise and the USD Index still undervalued, more headwinds should confront gold, silver, and mining stocks in the coming months. As a result, long-term buying opportunities are likely still a ways away.
Disclaimer: All essays, research and information found on the Website represent the analyses and opinions of Mr. Radomski and Sunshine Profits' associates only. As such, it may prove wrong ...
more

