
Even A Rebound In Juniors Was Weak
Just how weak can miners be? I mean, come on…
After a quite dramatic decline in price that happened on Tuesday (GDXJ declined by over 5% and our profits increased in response), one could have expected a volatile correction.
All we got was a tiny intraday upswing that was then followed by a decline to new yearly lows!

The junior miners were not able to be strong for even one full day! They moved to new 2023 lows while gold didn’t (it was close, though).
What’s next? I think you already know – a major slide is already underway, and the above suggests that it’s going to continue. And our profits are likely to move from being big to being huge.
But maybe I’m unnecessarily getting excited about very short-term price movements. So, let’s put things into perspective. I’d say that a 40+ year chart provides enough thereof.
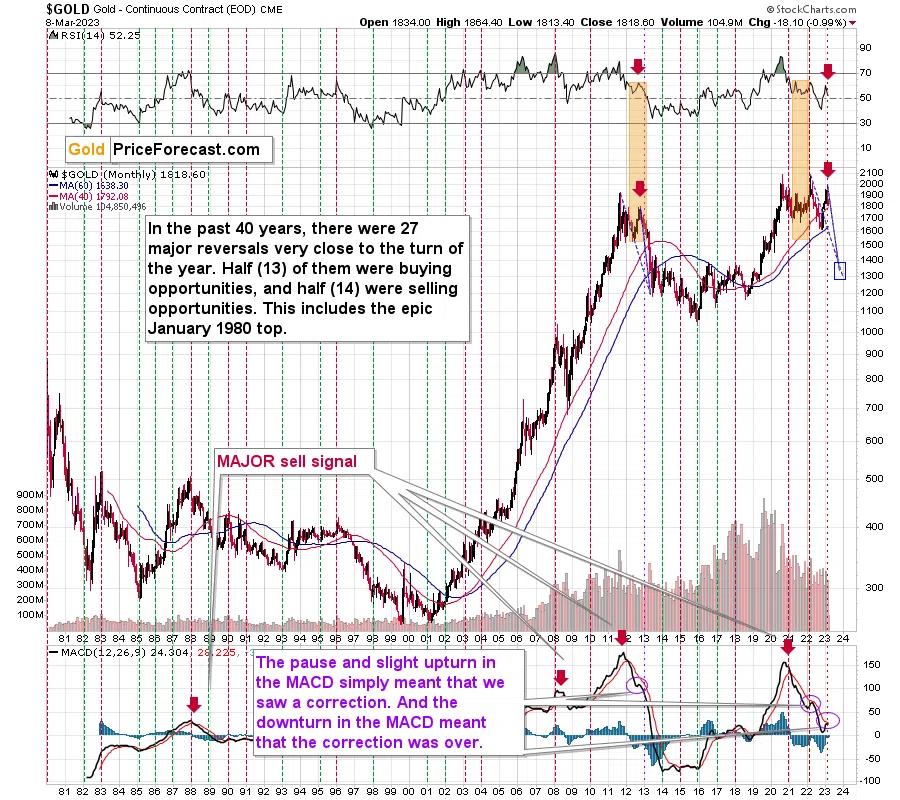
From a very long-term point of view, it’s clear that gold is repeating its 2012-2013 slide to a significant extent. The MACD and RSI indicators (in the lower and upper parts of the chart, respectively) clearly confirm that.
The only reason is that this time we saw two major tops and not one. And it’s no wonder that it happened because the regular technical patterns likely had to adjust to incorporate last year’s Russian invasion. That’s why history rhymes but doesn’t repeat the letter. The markets would “like to” repeat certain patterns, but they also “have to” react somehow to what’s going on in the world.
The reaction will ultimately be modified to fit what the market really wants to do, anyway, but it might take time before it becomes obvious. That’s why gold didn’t manage to hold its breakout above its 2011 high (in nominal terms!) despite a war outbreak in Europe.
Now, as the situation appears to have more or less stabilized after a sizable corrective upswing, the 2013-style slide is finally likely to continue.
The red arrows that I placed on the RSI (upper part of the chart) and on the gold price shows how the recent top aligns with the final 2012 top that started gold’s biggest downswing in many years.
I copied the sizes of the declines from previous major tops to the current situation. One decline is from the 2011 top and the other from the late-2012 top. Applying them to the recent tops suggests a downswing below $1,400. Will gold really slide as well? It’s quite possible, but it could also be stopped a bit above those levels. We’ll know more when gold gets closer to those levels.
For now, the key implication is that gold is likely to fall by hundreds of dollars from here, not by mere “tens.” If this is the case and if the stock market falls (and I think both are very likely), then junior mining stocks are likely to truly slide in the following months.
So, while the short-term price moves are exciting as it’s nice to see profits rise so quickly, it really is the case that it’s most likely just the beginning.
More By This Author:
Pullback In Gold Stocks Or A New, Powerful Decline?Silver’s Subtle Indication
Gold Trading Profits And Positions
Disclaimer: All essays, research and information found on the Website represent the analyses and opinions of Mr. Radomski and Sunshine Profits' associates only. As such, it may prove wrong ...
more

