
Equities/Commodities 12-Year Cycle Performance Outlook And Update

Image Source: Unsplash
Who says cycles don’t exist? Today, we put cycles on full display in looking at the performance of two of the most important asset classes: Equities and Commodities.
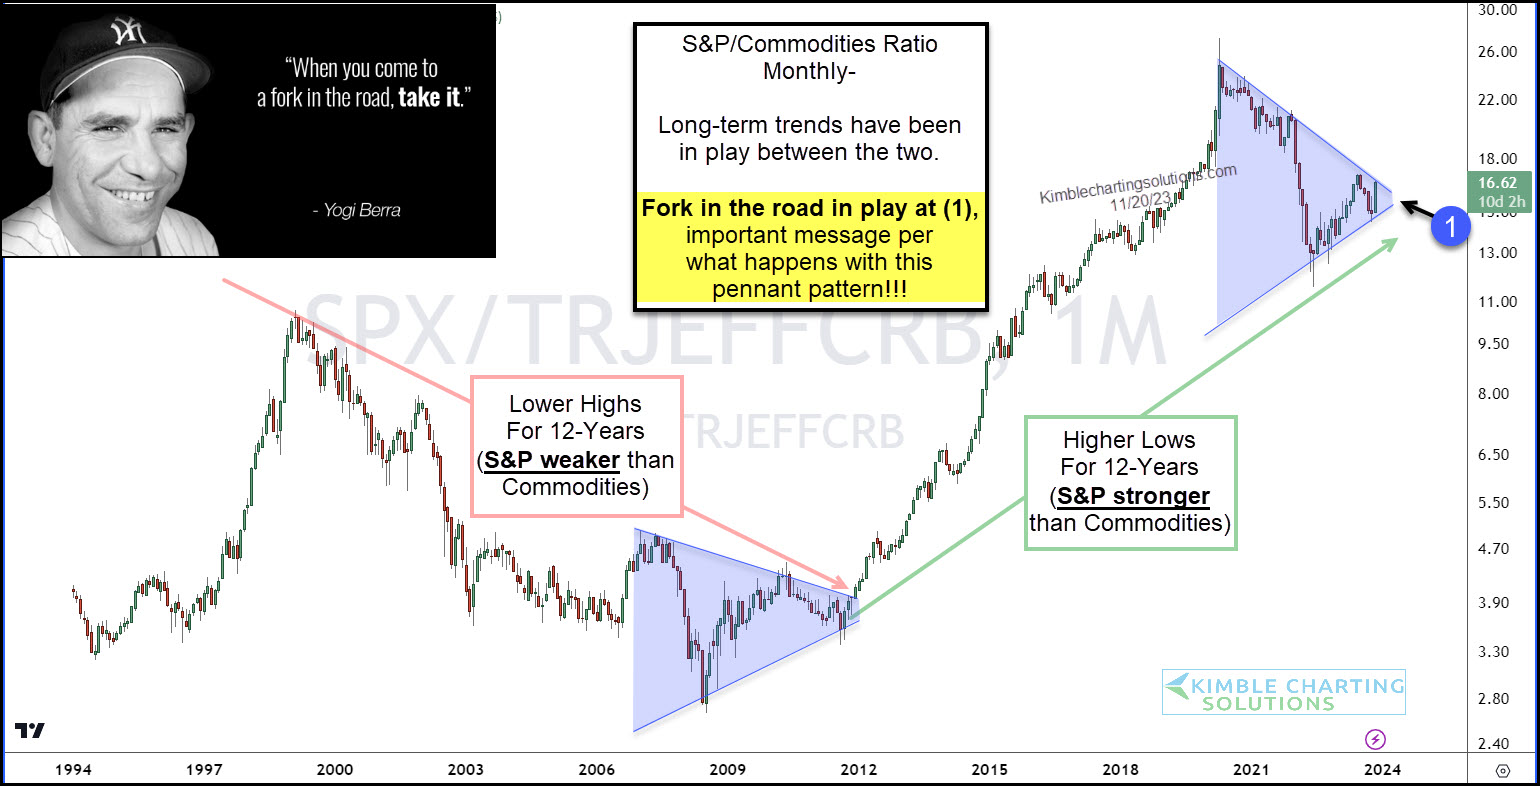
The chart below takes a long-term “monthly” view of the performance ratio of the S&P 500 Index/Thomson Reuters Commodities Index.
As you can see, a couple of long-term trends have been in play over the past 25 years. Moreover, looks like cycles of 12 years a piece (Commodities lead, then S&P 500 leads…).
Currently, a pennant pattern looks to be nearing completion at (1). The last time this pattern was in play, a long-term trend reversal took place.
Will equities continue to show strength and we see one more breakout… or will equities wilt in the face of commodities and break down.
In my humble opinion, what happens at (1), could send very important message about investment allocations!
(Click on image to enlarge)
More By This Author:
Are Semiconductors Nearing Cup With Handle Bullish Breakout?
Will U.S. Dollar Weakness Be Bullish For Gold & Silver?
Germany (DAX Index) About To Send A Critical Message To Stocks In The States
Disclosure: Sign up for Chris's Kimble Charting Solutions' email alerts--click here.


