Elliott Wave Technical Analysis Gold
Gold Elliott Wave Analysis
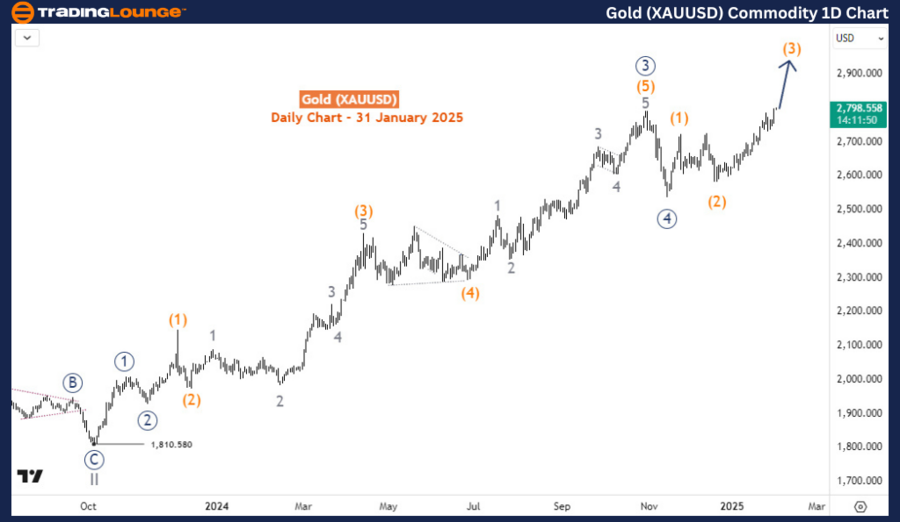
Gold has broken into a new record high to confirm the ending of the previous pullback and the continuation of the long-term bullish trend. In the short and medium term, the upside remains favored from pullbacks. Meanwhile, the current bullish cycle started in September 2022. based on this Elliott wave analysis, it appears this cycle is in the last leg. However, this previous leg could still extend toward 2900 or even higher.
Daily Chart Analysis
The daily chart captured the bullish cycle from 1,810 at the low of September 2022. At the low of September 2022, wave II finished and wave II started. Along this cycle price has evolved with an impulse 5-wave structure as expected for a 3rd wave. It appears the price has completed waves ((1))-((4)) of III and is now progressing in wave ((5)) from the low of November 2024. With the break of the wave ((3)) high, we can now confirm the wave (3) of ((5)). With (3) could extend toward 2900. Thus, there can still be good opportunities for buyers from the dip in the hourly charts.
H4 Chart Analysis
Wave (3) is still developing and the wave count can change as we have a series of 1-2-1-2 evolving. This is an early sign of an extended third. For now, we can take the rally from the 2689 low as the starting point for ((iii)) of 1 of (3) or already 3 of (3). However, one thing is clear - the upside should continue amid the varying possible counts.
Technical Analyst : Sanmi Adeagbo
More By This Author:
Unlocking ASX Trading Success: James Hardie Industries Plc
Elliott Wave Technical Analysis: McDonald’s Corp. - Friday, Jan. 31
Elliott Wave Technical Analysis: New Zealand Dollar/U.S. Dollar - Friday, Jan. 31
Analyst Peter Mathers TradingLounge™ Australian Financial Services Licence - AFSL 317817


.thumb.png.3d65fcb3350603c02a3ed219ca4ece14.png)


