Elliott Wave Outlook: Silver Might Have Launched Into The Following Leg Higher

Image Source: Pixabay
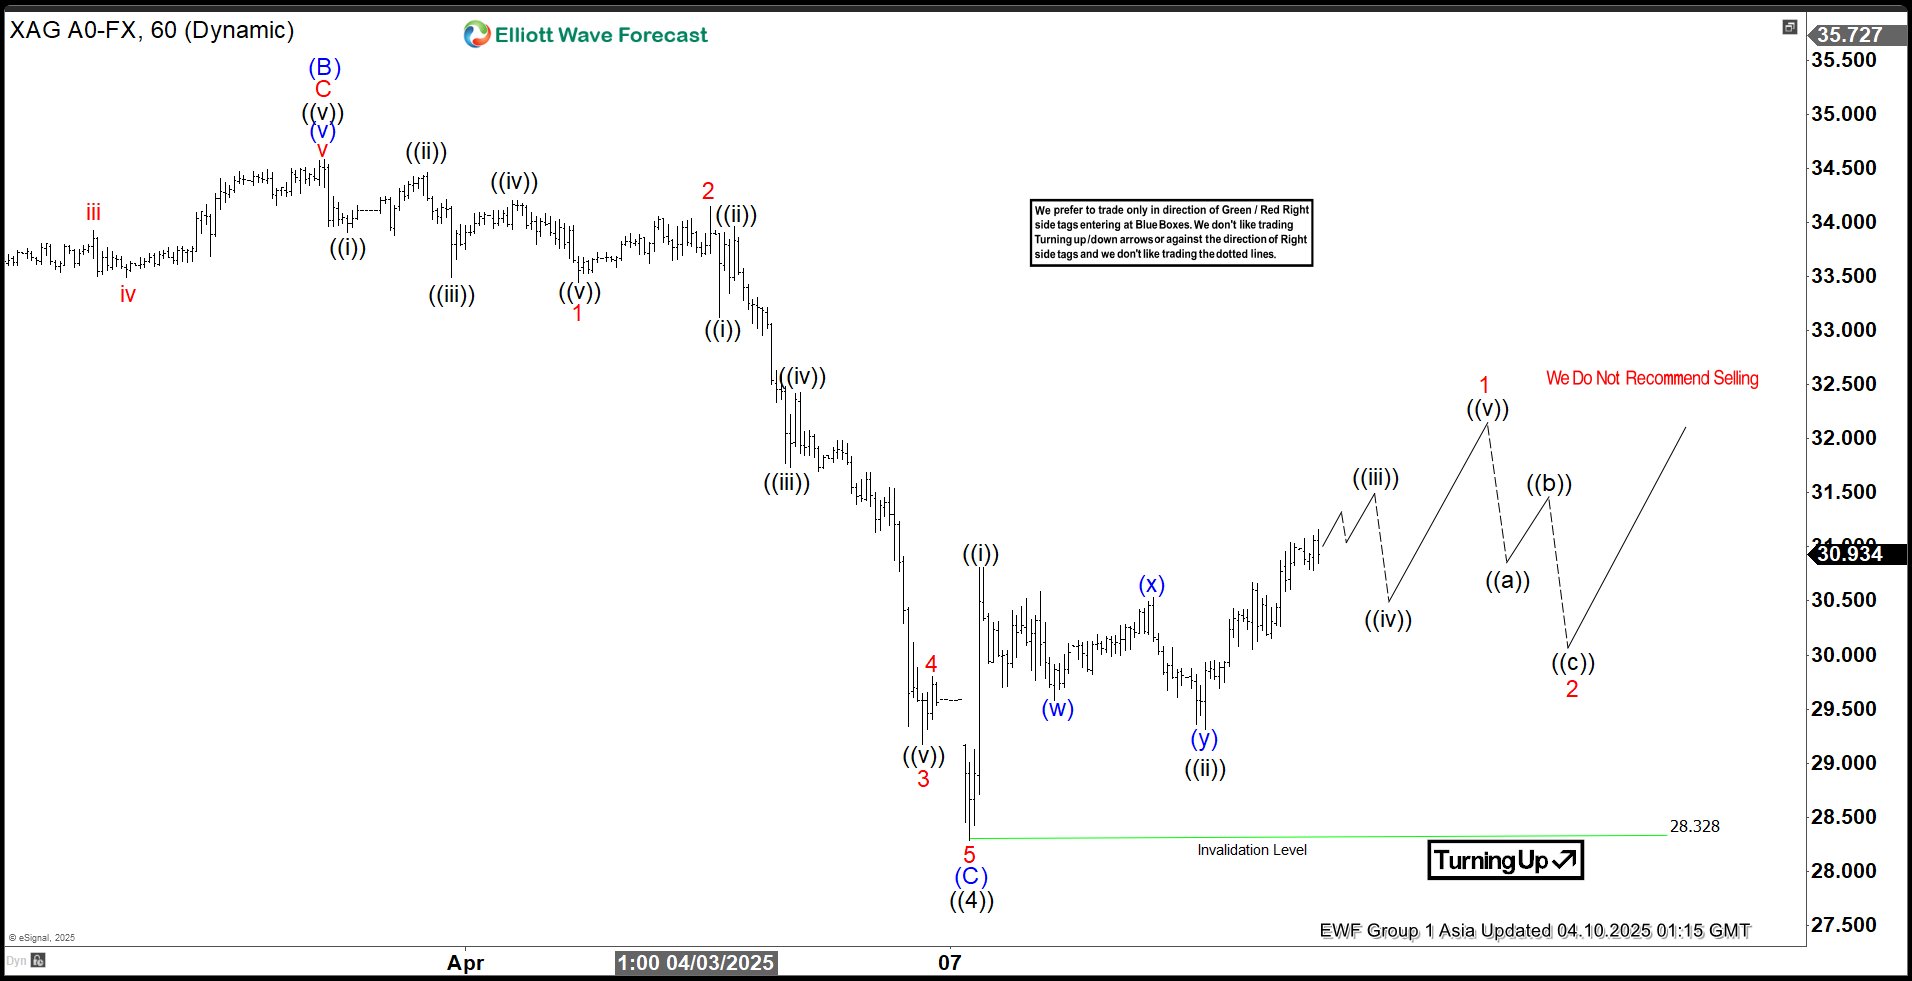
Silver (XAGUSD) has hit a key turning point after dropping from its October 23, 2024 peak. This decline unfolded in three distinct swings, following a zigzag pattern known as an Elliott Wave structure. Starting from that high, the first drop (wave A) landed at 29.68, followed by a bounce (wave B) to 34.58. Then, the final slide (wave C) bottomed out at 28.328, as seen on the hourly chart. This marked the end of a larger correction phase, called wave (4). Silver found its footing in a critical support zone between 24.86 and 28.56—a range calculated using Fibonacci tools, stretching 100% to 161.8% of the drop from the October high.
Now, silver is climbing again in what’s labeled wave (5). To confirm this upward trend, it needs to break past the prior peak of 34.86 from wave (3); otherwise, it might face another dip. Since bottoming out on April 7, 2025, at 28.328, silver rose to 30.81 (wave (i)), then eased back to 29.31 (wave (ii)). For now, as long as the 28.32 level holds firm, silver seems set to keep rising in the short term, offering hope for bullish traders.
XAGUSD (Silver) 60 Minute Elliott Wave Chart
XAGUSD (Silver) Video
Video Length: 00:03:57
More By This Author:
Elliott Wave Indicates Bearish Sequence For GBPJPY, Favoring A Downward TrajectoryLight Crude Oil Is Targeting Further Declines In The Near Term
SPX Elliott Wave : Incomplete Sequences Calling The Decline
Disclaimer: Futures, options, and over the counter foreign exchange products may involve substantial risk and may not be suitable for all investors. Leverage can work against you as well as for ...
more


