
Elliott Wave Analysis: Gold Approaches 1840-1850 Resistance Level
US stocks retested the lows yesterday so risk-off is still here, weakness that will try to be reversed later today, it depends on US economic data release. Philly Fed Manufacturing Index, Unemployment Claims and Existing Home Sales is something we should be watching later. Theoretically speaking, the USD can stay in a downtrend if US stocks will stay in bearish mode.

Image Source: Pixabay
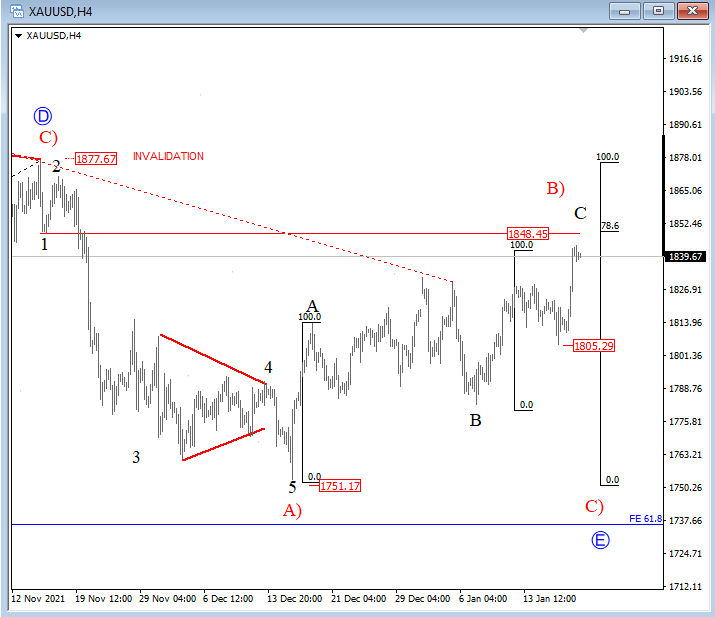
Gold is recovering in the 4h chart, now seen in the third leg of recovery which can be a final leg of a wave B) rally from 1751. Notice that metal approaching important resistance near 1840/1850 where we see the 78.6% Fibonacci retracement, plus wave C equals A in that area as well.
This appears to be like a strong technical resistance so be aware of a potential slow down, especially if we consider that higher degree wave E from 1877 is incomplete, which belongs to a triangle. A drop back towards 1805 will be bearish, while bullish price action would need a rise above 1877.
Gold 4h Elliott Wave analysis
Disclosure: Please be informed that information we provide is NOT a trading recommendation or investment advice. All of our work is for educational purposes only.

Comments
 No Thumbs up yet!

