
Brent Crude Oil Fundamental Backdrop
Brent crude oil is trading marginally higher this Thursday although still relatively depressed due to the news about the G-7 proposal to increase the Russian oil price cap from around $60 to $65-$70. What this means for oil markets is that if this new range is agreed upon, Russia is then unlikely to cut off supply as these prices would be the case with the $60 level. The reason behind this is the fact that Urals (Russian crude oil) has been selling at these levels relative to Brent crude. This being said, there was no agreement made by the member nations with the discussion set to continue today.
In addition, one of the principal aims of the price cap is to financially handicap Russia and will likely have minimal to zero impact on the Russians exhibiting the EU’s preference for supply stability.
Last night, EIA weekly storage data tracked the prior API data set with the stocks change dropping more than expected to 3.69MMbbls but was unable to deter Brent prices.
The USD also weakened yesterday and continues through to today which makes the downward move on Brent that much more significant highlighting the importance of the price cap data. A slew of U.S. economic data was released yesterday with upside surprises on both consumer sentiment and durable goods orders however, initial jobless claims exceeded forecasts and PMI data missed on all metrics. The much-awaited FOMC minutes were somewhat disappointing with no new information coming to light but rather reiterating the need for interest rate hike moderation fueling a dollar selloff.
With no U.S.-centric economic data for the rest of the week due to the Thanksgiving holiday, volatility may remain subdued unless we see further clarification around the Russian oil price cap as well as possible OPEC member statements addressing the rumored production increase earlier this week.
From a demand-side perspective, China’s COVID cases have reached record numbers today leaving forecasts for the crude oil’s principal consumer depressed until such time as the virus can be contained allowing for lesser restrictive measures.
Technical Analysis
Brent Crude (LCOc1) Daily Chart
(Click on image to enlarge)
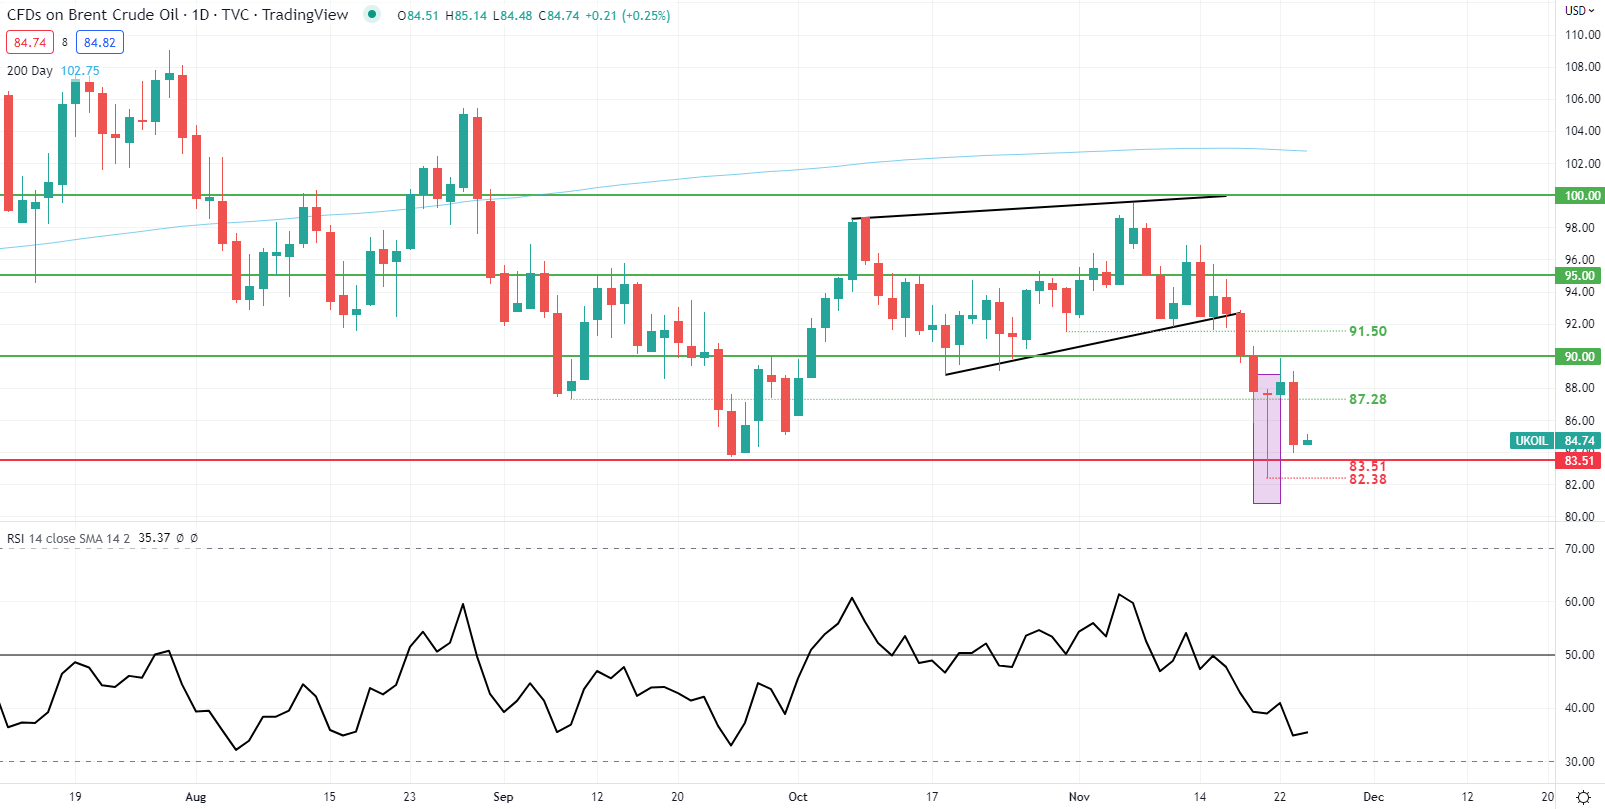
Chart prepared by Warren Venketas, IG
Price action on the daily Brent crude chart reflects the mounting headwinds. I do foresee scope for further downside but price is going to be dependent on OPEC+ next week as well as clarity around the Russian oil cap.
Key resistance levels:
- $90.00
- $87.28
Key support levels:
- $83.51
- $82.38
IG Client Sentiment: Bearish
IGCS shows retail traders are NET LONG on Crude Oil, with 86% of traders currently holding long positions (as of this writing). At DailyFX we typically take a contrarian view to crowd sentiment however, due to recent changes in long and short positioning we settle on a short-term downside bias.
More By This Author:
New Zealand Dollar Whipped By Jumbo Rate Hike. Will NZD/USD Rally Continue?
S&P 500 At Risk Of Breakout As PMIs Hit But Follow Through Would be A Problem
Euro Breaking News: EUR On Offer Despite EZ PMI Upside Surprise


Comments
Log in or sign up to join the conversation.