

Image Source: Unsplash
- WTI eased to $80.00 per barrel on Wednesday, continues to churn in a rough range.
- EIA Crude Oil counts reported another week-on-week buildup of US barrel supplies.
- Energy markets continue to hope for a demand upswell to materialize in summer.
West Texas Intermediate (WTI) US Crude Oil tumbled back to $80.00 per barrel on Wednesday after the Energy Information Administration (EIA) reported another unexpected increase in week-on-week US Crude Oil Stocks Change, kicking the legs out from beneath barrel traders that were hoping for a net decrease in US Crude Oil supplies.
According to the EIA, US Crude Oil Stocks Change piled on an additional 3.591 million barrels of Crude Oil for the week ended June 21, well above the forecast -3 million barrel decline and flooding out the previous week’s -2.547 million barrel drawdown. US Crude Oil markets shuddered after another week-on-week buildup, sending WTI back to the $80.00 handle on reaction.
Energy markets are still holding onto hopes of a summertime uptick in fossil fuel demand on the back of increased cooling costs, as well as the summer driving season. This follows a flubbed uptick in Chinese Crude Oil demand that failed to materialize, as well as the US Memorial Day holiday driving season that also failed to make a meaningful dent in US Crude Oil supplies.
WTI technical outlook
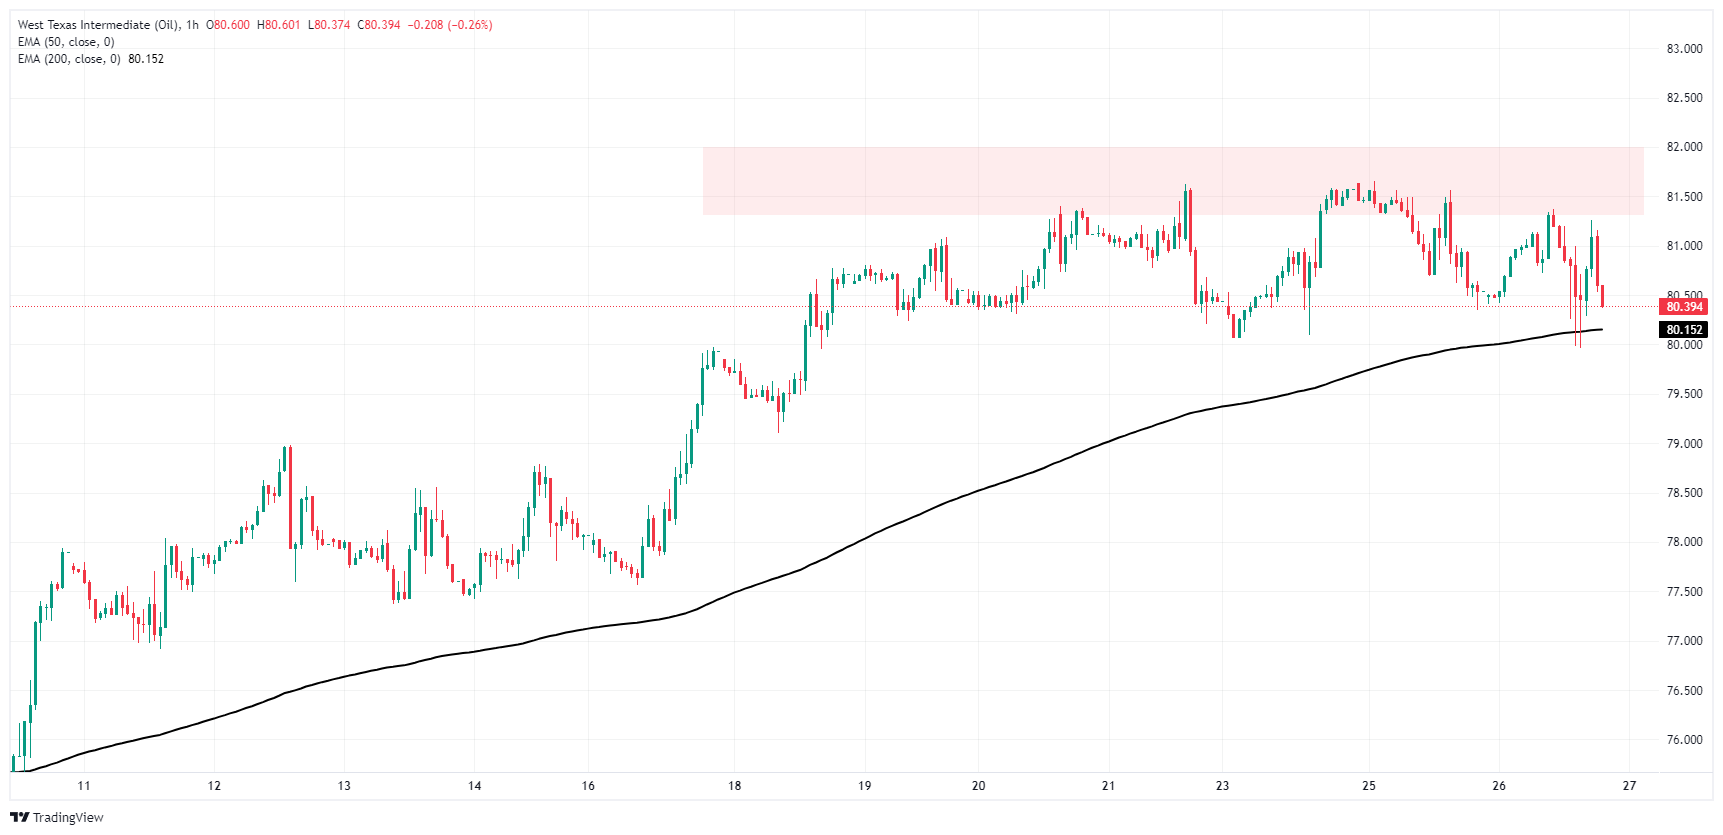
WTI continues to trade in a rough range priced in between $80.00 and $81.50, with a hefty supply zone keeping upside momentum hobbled beyond $81.50. Intraday price action is clattering against the 200-hour Exponential Moving Average (EMA) rising through the $80.00 handle.
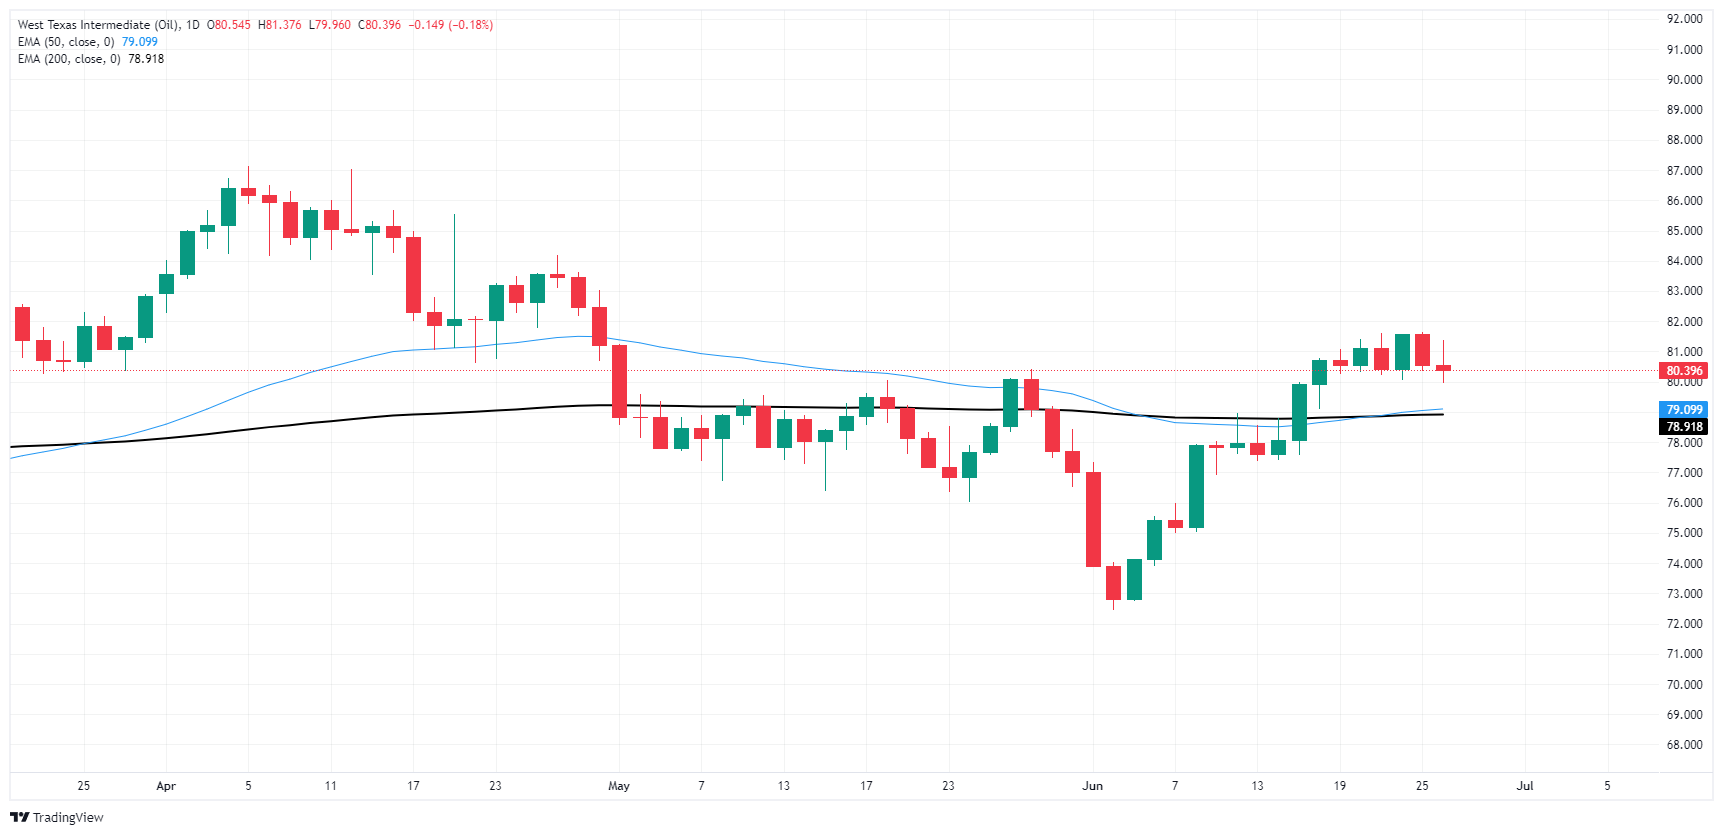
Daily candlesticks continue to middle around the $81.00 handle, and continued consolidation opens the way up for a bearish turnaround towards the low side of the 200-day EMA at $78.91. A downside push will leave WTI bids exposed to a further decline to early June’s swing low below $73.00 per barrel.
WTI hourly chart
WTI daily chart
More By This Author:
EUR/USD Treads Water In Familiar Chart Territory Ahead Of Thin Wednesday
EUR/USD Catches A Ride On Broad-Market Greenback Weakness
Crude Oil Backs Away From Fresh Highs On EIA Natural Gas Buildup


Comments
Log in or sign up to join the conversation.