
Crude Oil Prices Rise As China Assures Markets, Trend Points Down
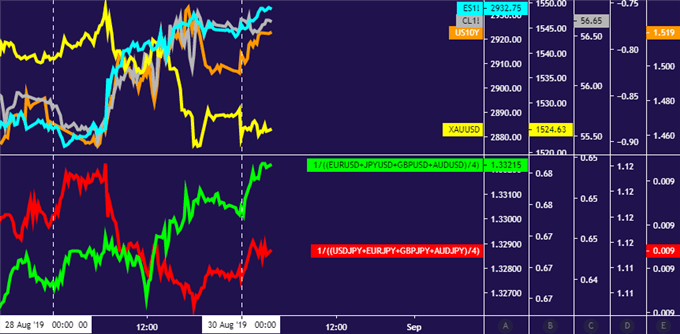
Crude oil, gold price performance chart created using TradingView
Crude oil prices rose alongside stocks as markets cheered assurances from China that it won’t discriminate against or crackdown on foreign companies amid trade war escalation. The remarks were delivered by MOFCOM spokesman Geo Feng.
The risk-on tilt drove bond yields upward and undermined the appeal of non-interest-bearing assets, pushing gold prices downward. Revised US GDP data nudged the US Dollar higher, compounding pressure on the yellow metal. It showed consumption – the largest growth contributor – expanded faster than expected.
CRUDE OIL MAY BACKTRACK AS GOLD GAINS BEFORE THE WEEKEND
Financial markets are sending conflicting cues about what is likely to transpire in the hours ahead. In the G10 FX space, the anti-risk Japanese Yen is outperforming while the sentiment-linked Australian and NewZealand Dollars are suffering outsized losses. That points to a defensive bias.
Meanwhile, bellwether S&P 500 stock index futures are pointing upward, suggesting risk appetite might hold up through the weekly close. True trend development in this direction seems unlikely, however, with traders probably too leery of “Tweetstorm volatility” to carry much risk-on exposure through the weekend.
With that in mind, currency markets probably have it right. That means the path of least resistance points lower for crude oil prices while gold might recover a bit of lost ground. The Fed’s favored PCE inflation gauge headline the data docket, with the core rate expected to hold steady at 1.6 percent on-year.
GOLD TECHNICAL ANALYSIS
Gold prices pulled back to near-term support at 1524.10. A daily close below this would break the near-term uptrend, exposing 1480.00 next. Negative RSI divergence bolsters the case for topping. Critical resistance continues to be marked by a weekly chart inflection level at 1563.00.
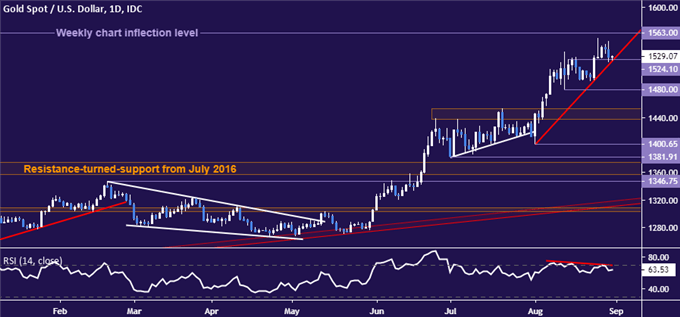
Gold price chart created using TradingView
CRUDE OIL TECHNICAL ANALYSIS
Crude oil prices are pushing up against trend resistance set from late April. A daily close above its upper layer – now at 57.59 – exposes the 60.04-84 area. Alternatively, a turn downward that clears the August 26 low at 52.96 sets the stage for a challenge of long-standing support clustered near the $50/bbl figure.
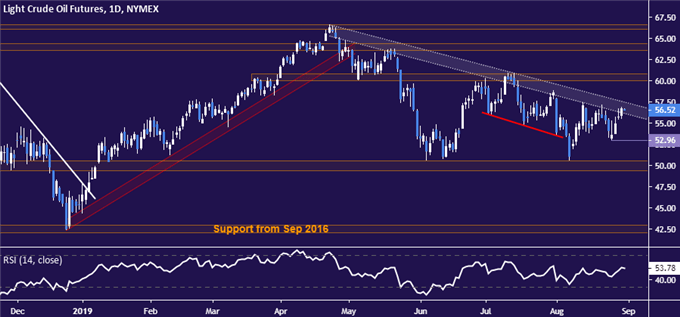
Crude oil price chart created using TradingView


