

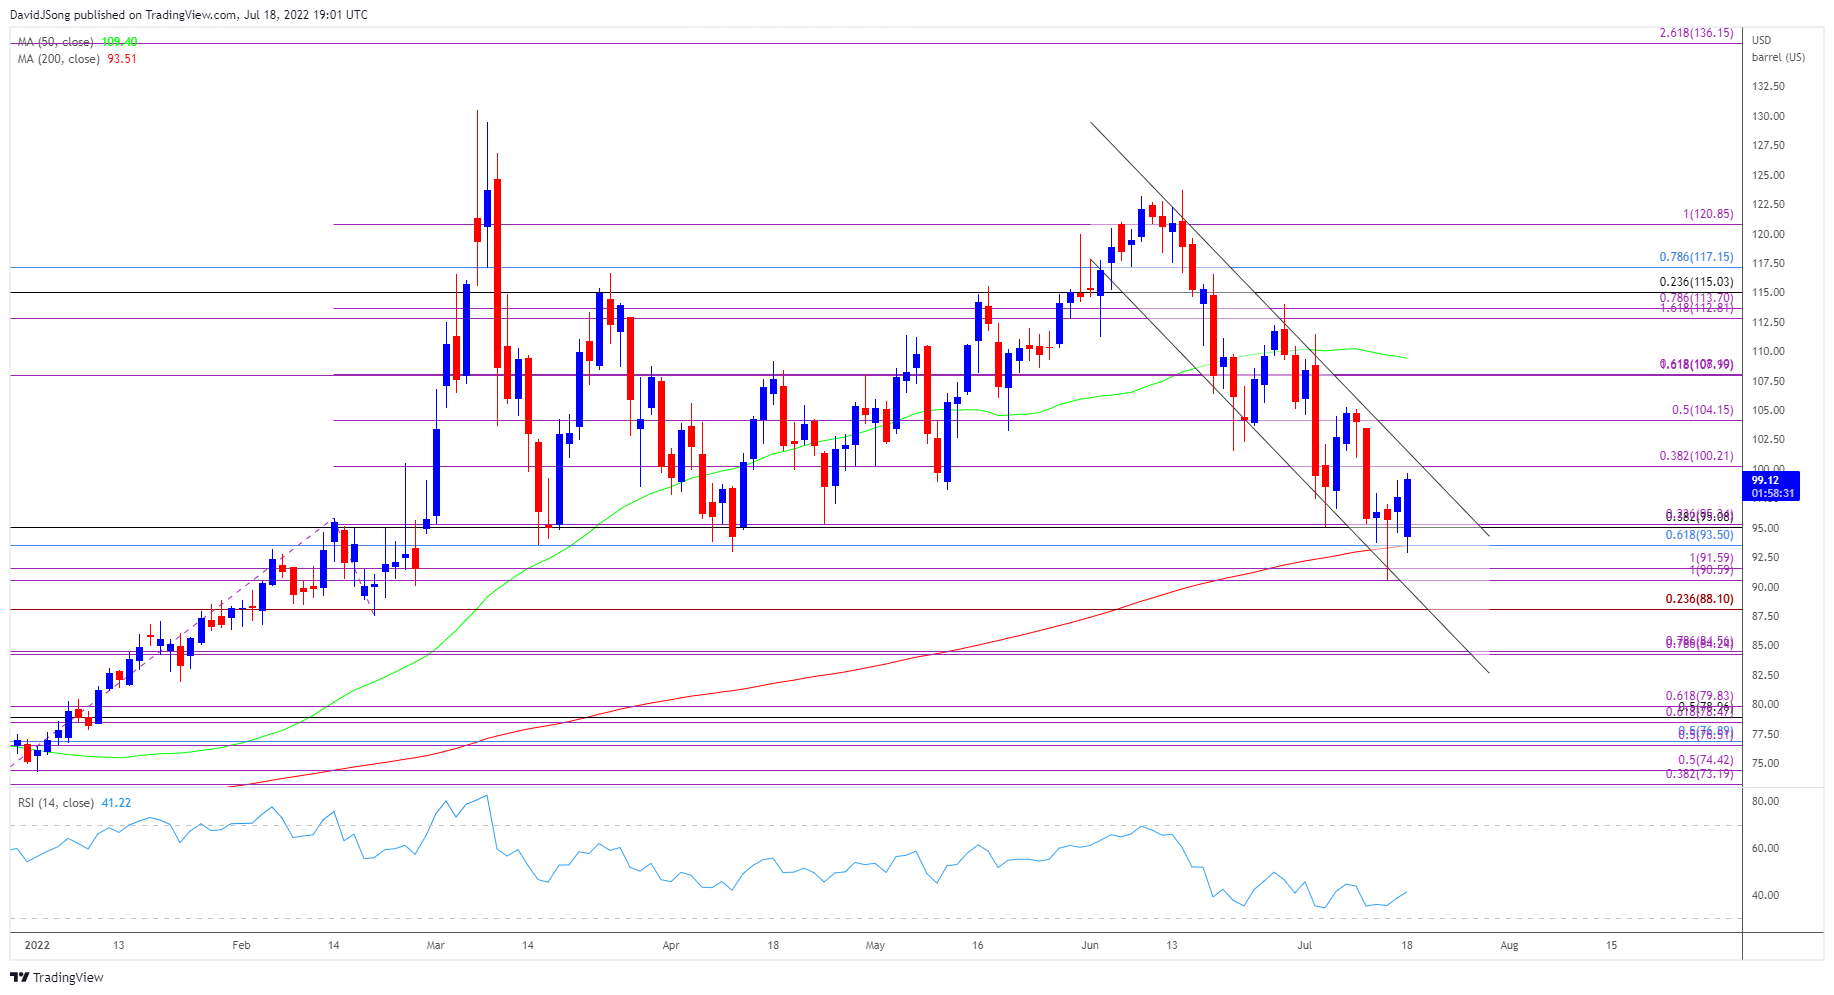
The price of oil extends the rebound from the monthly low ($90.56) as it bounces back from channel support, but lack of momentum to hold above the 200-Day SMA ($93.50) may indicate a potential shift in the broader trend as crude tests the moving average for the first time this year.
The bearish trend may persist over the near-term as the Organization of Petroleum Exporting Countries (OPEC) plan to “adjust upward the monthly overall production for the month of August 2022 by 0.648 mb/d,” and it remains to be seen if the group will retain the revised schedule at the next Ministerial Meeting on August 3 as the most recent Monthly Oil Market Report (MOMR) warns of slower demand in 2023.
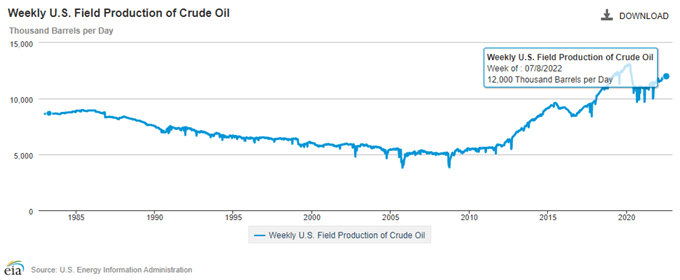
Until then, data prints coming out of the US economy may sway the price of oil as the last update from the Energy Information Administration (EIA) shows a slowdown in energy output, with weekly field production slipping to 12,000K in the week ending July 8 from 12,100K the week prior.
A further decline in US output may generate a larger rebound in the price of oil as OPEC insists that “for 2022, world oil demand is foreseen to rise by 3.4 mb/d, unchanged from last month’s estimate,” but the rebound from the monthly low ($90.56) may end up being short lived as crude trades within the downward trending channel.
With that said, the price of oil may face headwinds as it comes up against channel resistance, and failure to hold above the 200-Day SMA ($93.51) may highlight a shift in the broader trend as crude tests the moving average for the first time this year.
CRUDE OIL PRICE DAILY CHART
(Click on image to enlarge)
Source: Trading View
- The price of oil trades back above the 200-Day SMA ($93.51) as it extends the rebound from the monthly low ($90.56), with a break/close above the $100.20 (38.2% expansion) area raising the scope for a larger recovery as it breaks out of a descending channel.
- However, the price of oil may continue to track the downward trend as it comes up against channel resistance, and lack of momentum to break/close above the $100.20 (38.2% expansion) area may push crude back towards the Fibonacci overlap around $93.50 (61.8% retracement) to $95.30 (23.6% expansion), with the next region of interest coming in around $90.60 (100% expansion) to $91.60 (100% expansion).
- Failure to defend the monthly low ($90.56) may push the price of oil towards $88.10 (23.6% expansion), with the next area of interest coming in around $84.20 (78.6% expansion) to $84.60 (78.6% expansion).
More By This Author:
USD/JPY Eyes September 1998 High as RSI Pushes Into Overbought Territory
Crude Oil Price Eyes April Low as OPEC Forecasts Slower Demand in 2023
AUD/USD Eyes June 2020 Low After Failing to Defend July Opening Range

Comments
Log in or sign up to join the conversation.