Crude Oil Latest – Will US CPI Help To Provide Any Demand Clarity?
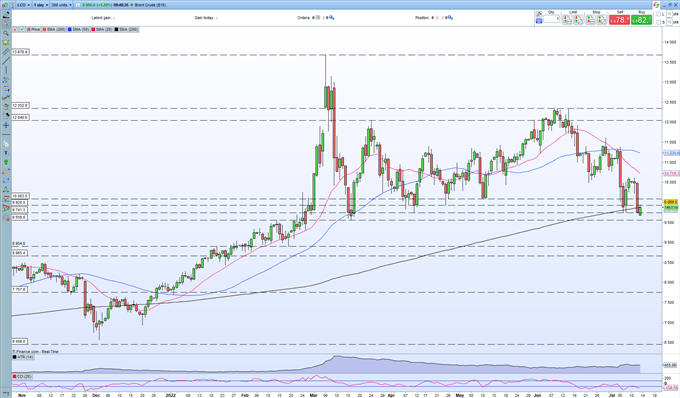
The oil complex is trying to nudge higher in early trade after Tuesday’s heavy sell-off caused prices to slump by around 8% and hit lows last seen over four months ago, despite tight supply conditions. The push-and-pull between supply and demand is expected to continue over the coming months, leaving oil at risk of further volatility.
A look at Brent Crude futures shows that the market remains in backwardation, where front-month oil contracts trade at higher prices than longer-dated contracts. According to ICE Europe data, the September Brent future is trading at $100.28/bbl. the November contract is at $96.90, while the December contract currently changes hands at $94.37. This backwardation is due to supply concerns triggered by sanctions on Russia after they invaded Ukraine. Russia is the world’s third-largest oil producer, behind Saudi Arabia and the United States, and the sanctions on their oil sales are being felt across the globe.
Later today, the U.S. Bureau of Labour Statistics will release its monthly inflation data. The June headline inflation reading y/y is expected to rise to 8.8% from 8.6% in May, while the core reading is seen falling to 5.7% from 6.0%. Today’s data will give traders a better read of US price pressures and will likely fuel further debate about how the Federal Reserve will act in the coming months. If traders believe that the Federal Reserve is getting inflation under control, the recession narrative will become stronger and demand for oil will fall further, dragging the price of oil with it.
For all market-moving economic data and events, see the DailyFX calendar.
Brent crude is currently trading on either side of the 200-day simple moving average, an indicator that it has not closed below since last December. If the 200-sdma holds firm, a rebound back to $100/bbl. would open the way to a larger move to the recent $106.30/bbl. double top. A close and open below the 200-dsma leaves $95.60/bbl. vulnerable.
Brent Crude Daily Price Chart
(Click on image to enlarge)

The IG retail data below shows that customers ramped up their net-long positions sharply yesterday and cut back on their short positions.
If we look at US Crude Oil, IG retail trade data show 68.90% of traders are net-long with the ratio of traders long to short at 2.22 to 1. The number of traders net-long is 66.72% higher than yesterday and 15.58% higher from last week, while the number of traders net-short is 35.42% lower than yesterday and 13.33% higher from last week.
We typically take a contrarian view to crowd sentiment, and the fact traders are net-long suggests Oil - US Crude prices may continue to fall. Traders are further net-long than yesterday and last week, and the combination of current sentiment and recent changes gives us a stronger Oil - US Crude-bearish contrarian trading bias.
What is your view on Crude Oil – bullish or bearish?
More By This Author:
British Pound Latest – GBP/USD Bludgeoned By A Rampant US Dollar
USD/JPY Outlook – A Fresh Multi-Decade High But The Move Looks Tired
Bitcoin, Ethereum Forecasts – Grinding Higher In Quiet Conditions
Disclosure: See the full disclosure for DailyFX here.


