Crude Oil Is Attacking $120
Image Source: Unsplash
The commodity market is full of bulls on Monday. Brent is moving a bit higher than $120 and feels like continuing the rally.
On one hand, there are fundamental reasons, for example, a piece of news from Saudi Arabia, which raised its May official selling price (OSP) to Asia for its flagship Arab Light crude. One may assume that the country is expecting an explosive growth of energy prices, which won’t probably be covered even by the expanded oil extraction limits accepted by OPEC+ earlier.
On the other hand, oil producers are in no hurry to increase their output. The latest report from Baker Hughes showed that over the past week, the Oil Rig Count in the US didn’t change. In Canada, the indicator increased by 17 units, up to 72. The lack of positive dynamics in the US might signal that the shale industry won’t show any improvements in the shale oil output in the second half of 2022.
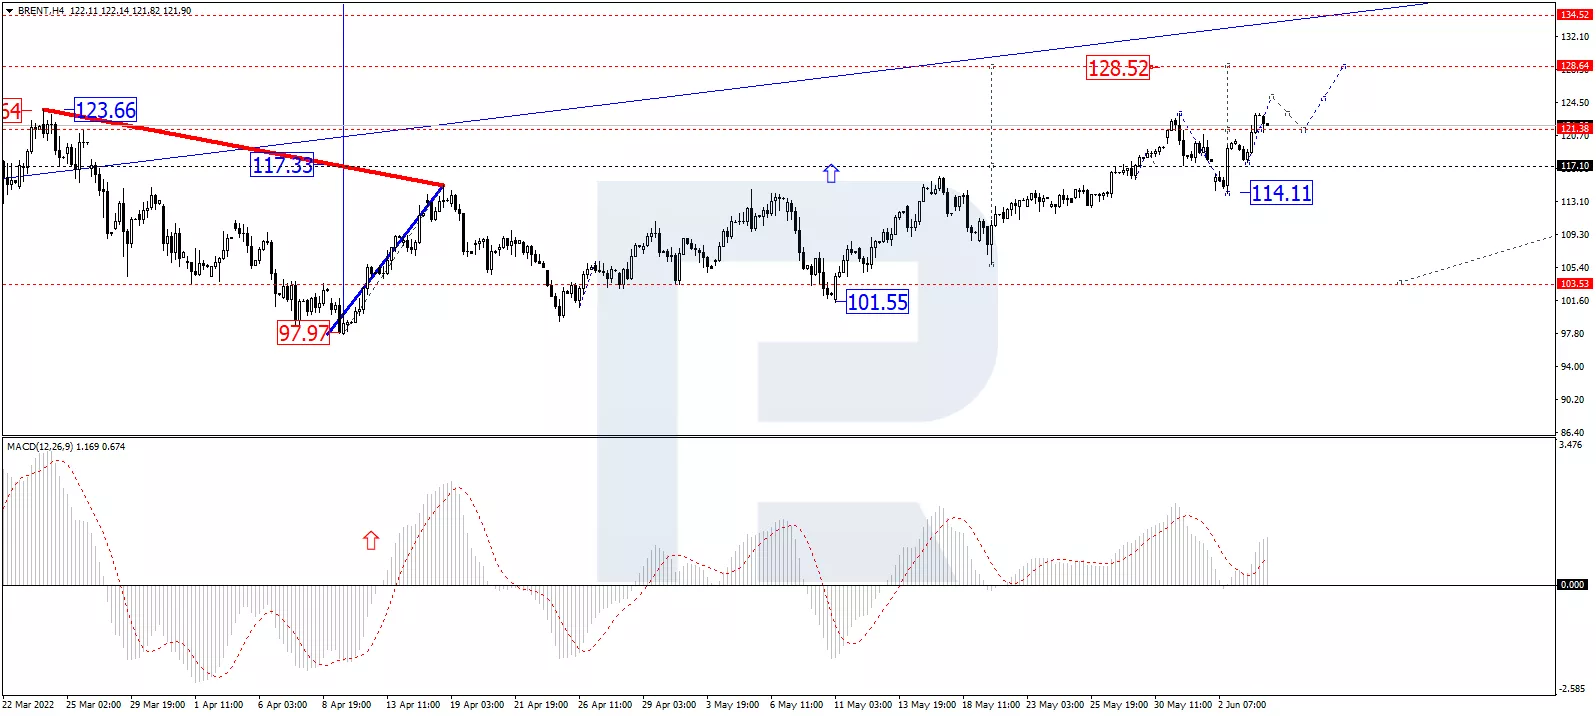
In the H4 chart, after breaking 121.38 upwards, Brent is expected to continue moving within the uptrend and reach 128.52. After that, the instrument may correct to return to 121.38 and then form one ascending wave with the target at 134.50. From the technical point of view, this scenario is confirmed by MACD Oscillator: its signal line is growing above 0 within the histogram area, which means that the uptrend in the price chart may continue.
(Click on image to enlarge)

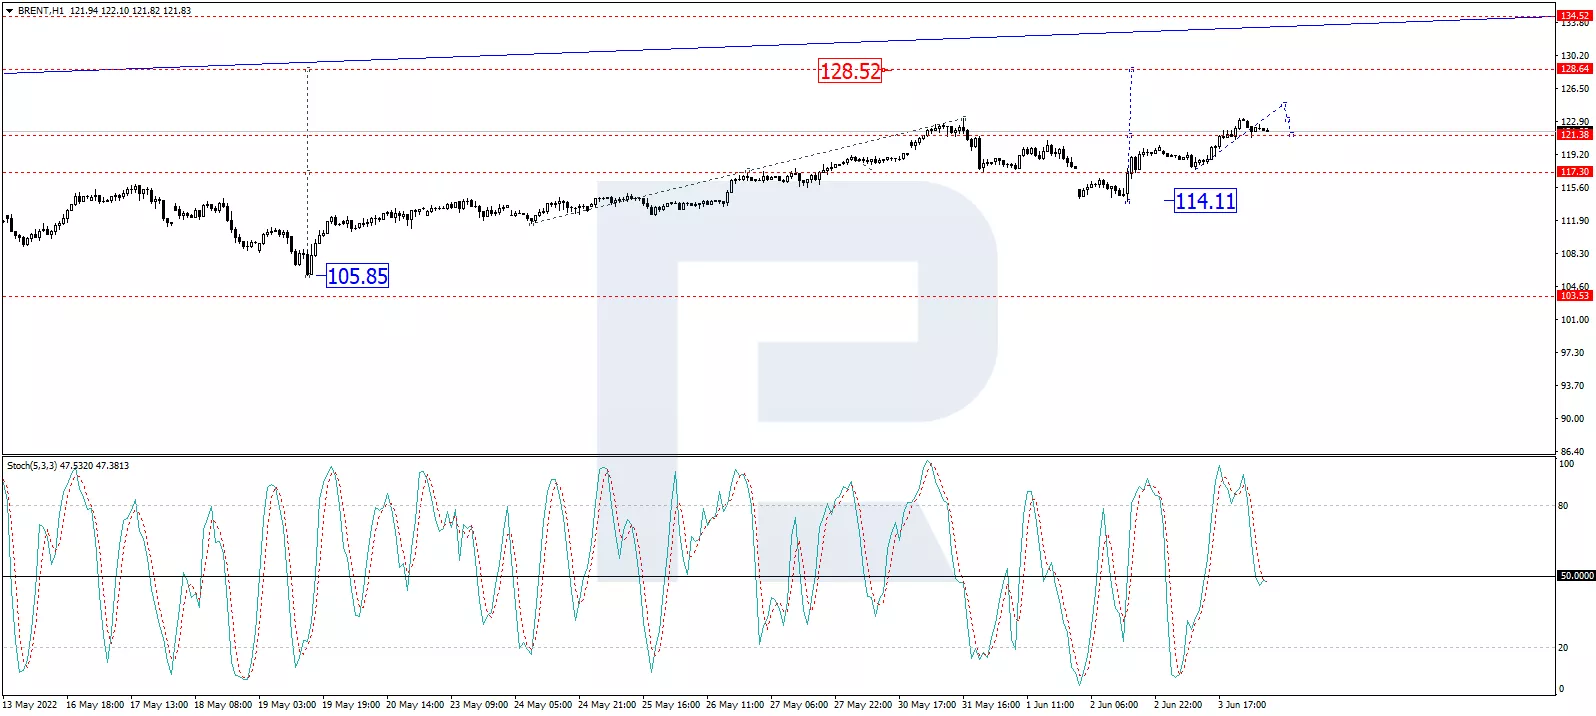
As we can see in the H1 chart, Brent is forming the third ascending wave with the target at 128.50; right now, it is forming the fifth structure inside this wave. The asset has already completed the ascending impulse at 123.22 along with the correction down to 121.38, thus forming a new consolidation range around 121.38. If later the price breaks this range to the upside, the market may resume growing towards 125.00 or even reach the above-mentioned target; if to the downside – start another correction down to 117.10 and then resume trading upwards to reach 128.50. From the technical point of view, this idea is confirmed by the Stochastic Oscillator: after falling towards 50, its signal line is expected to reach 20 and may rebound from this level. Later, the line may grow to break 50 and continue moving towards 80.
(Click on image to enlarge)

Disclaimer: Any forecasts contained herein are based on the author's particular opinion. This analysis may not be treated as trading advice. RoboForex bears no responsibility for trading ...
more


