
Crude Oil Drops To A New Year Low – What’s Happening?
Here’s how to make sense of the different figures reported by the Energy Information Administration (EIA).
Macroeconomics
From a macroeconomic point of view, the US dollar index (DXY or USDX) has maintained its downward trend within its recent regression channel, probably still eyeing the next quarterly S2 pivot just located at the $100 mark.
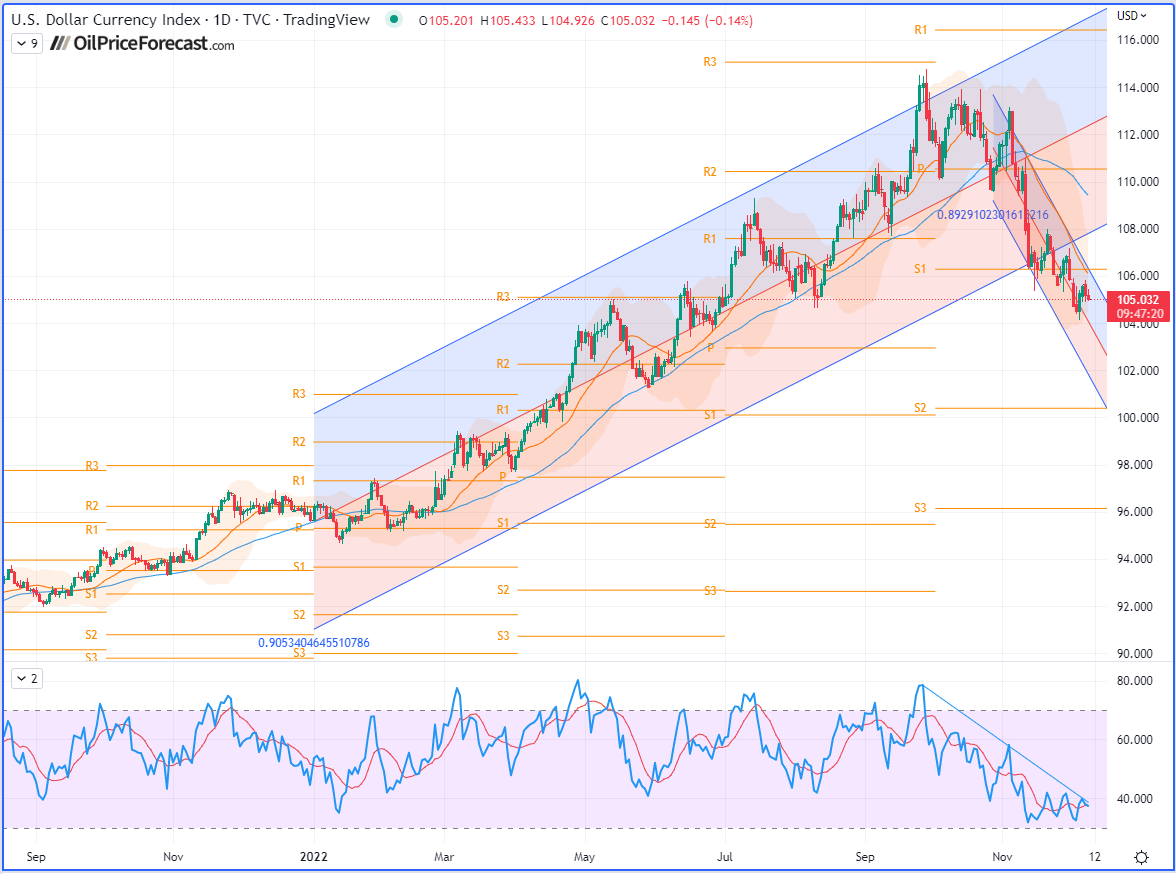
U.S. Dollar Currency Index (DXY), daily chart
As we will see in this article, a certain lack of appetite for petroleum products is fueling the general impression of anemic demand, stifled by hikes in key interest rates by central banks (the Federal Reserve, the European Central Bank, the Bank of England, etc.) around the world combined with the slowing economy.
Geopolitical and Fundamental Analysis
The price of a barrel of West Texas Intermediate (WTI) closed Wednesday down 3% after falling a moment earlier to its lowest level of the year ($71.75 on the January futures contract). As the geopolitical fears were placed in the background, even the EU’s price cap on Russian oil has not really impacted the market, as I mentioned last week, given that Russia has made investments into its own fleet of oil tankers, so they have the option to deliver their Urals crude oil by putting their own conditions or even simply finding other clients eventually.
Already resolutely on the downside for several days as concerns over supply risk are gradually evaporating, the black gold market was encouraged to continue in this downward momentum by the EIA’s weekly report on US crude oil inventories.
U.S. Crude Oil Inventories

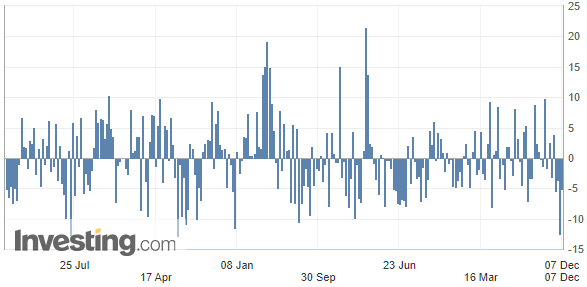
(Source: Investing.com)
Operators ignored the significant contraction of 5.187 million barrels in commercial crude reserves to focus on stocks of refined products to get an overview of US petroleum demand.
U.S. Gasoline Inventories

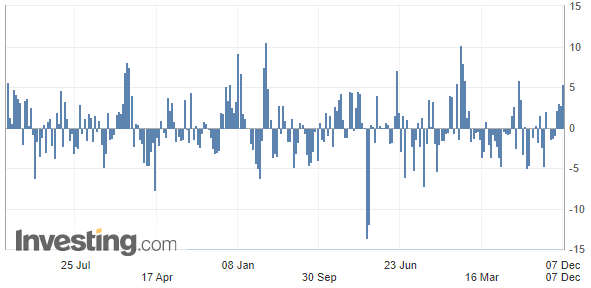
(Source: Investing.com)
The oil market is sinking due to a significant increase in gasoline stocks, which rose by 5.320 million barrels, nearly doubling expectations (2.7 million barrels).
U.S. EIA Weekly Distillates Stocks
Now, regarding the reserves of distilled products – such as diesel, mainly – they also increased significantly, by 6.159 million barrels versus the 2.2 million barrels forecasted.

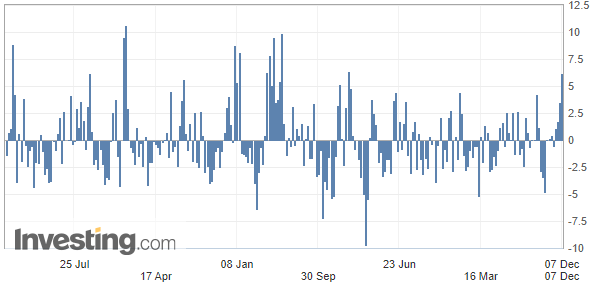
(Source: Investing.com)
In fact, this figure has to be compared to the demand for refined products in the United States, which remained, last week, below its level of 2021 at the same time, whereas on average over the past four weeks, the demand for gasoline dropped more than 7% lower than a year ago.
Finally, OPEC+’s decision last Sunday (Dec 4th) to maintain their production and not reduce it further, is another bearish factor.
Technical Charts
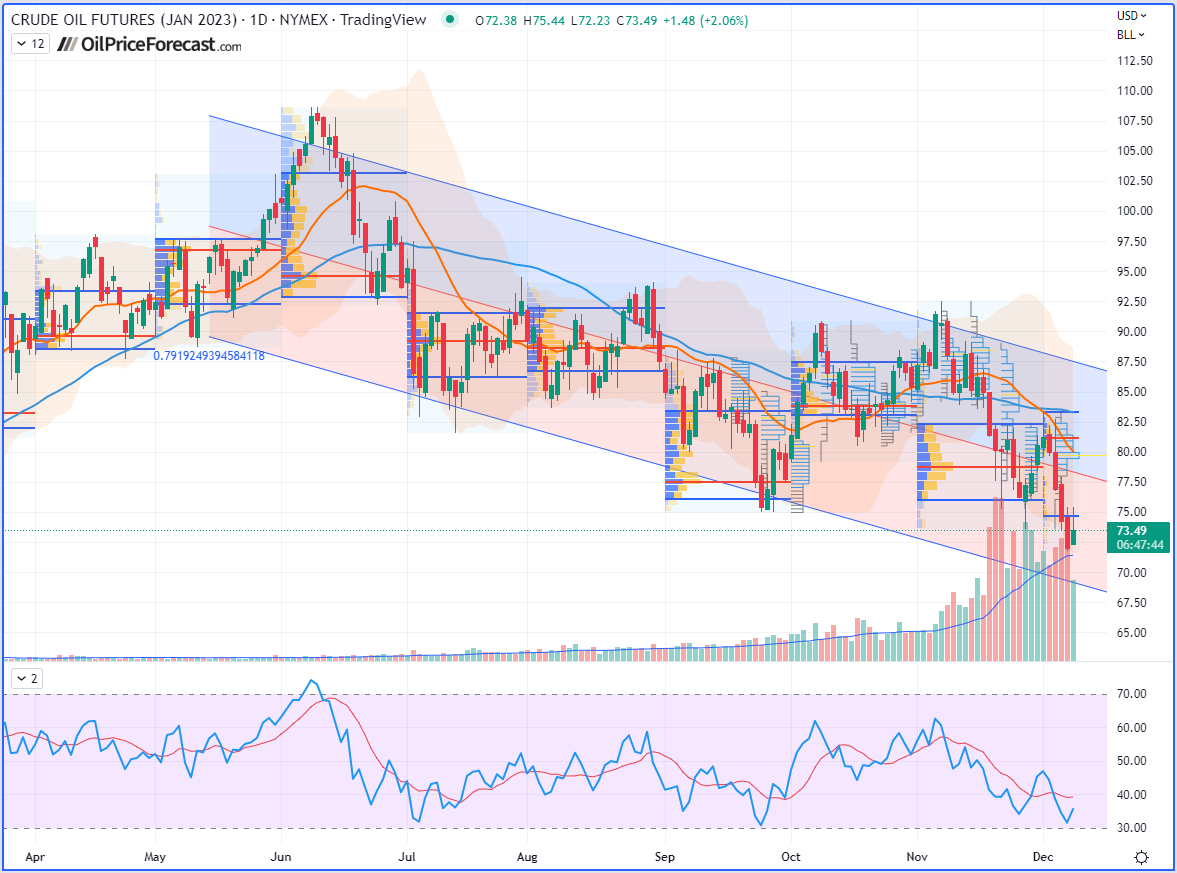
WTI Crude Oil (CLF23) Futures (January contract, daily chart)
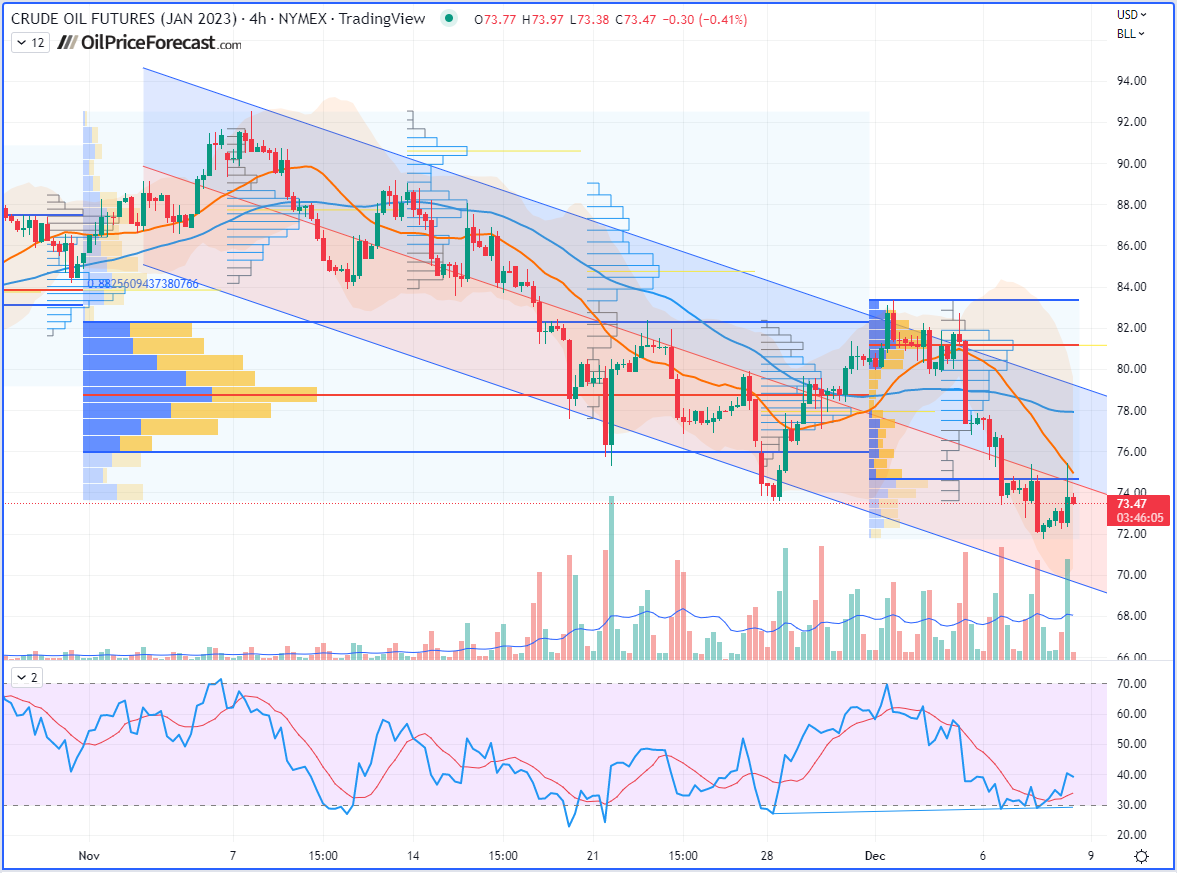
WTI Crude Oil (CLF23) Futures (January contract, 4H chart)
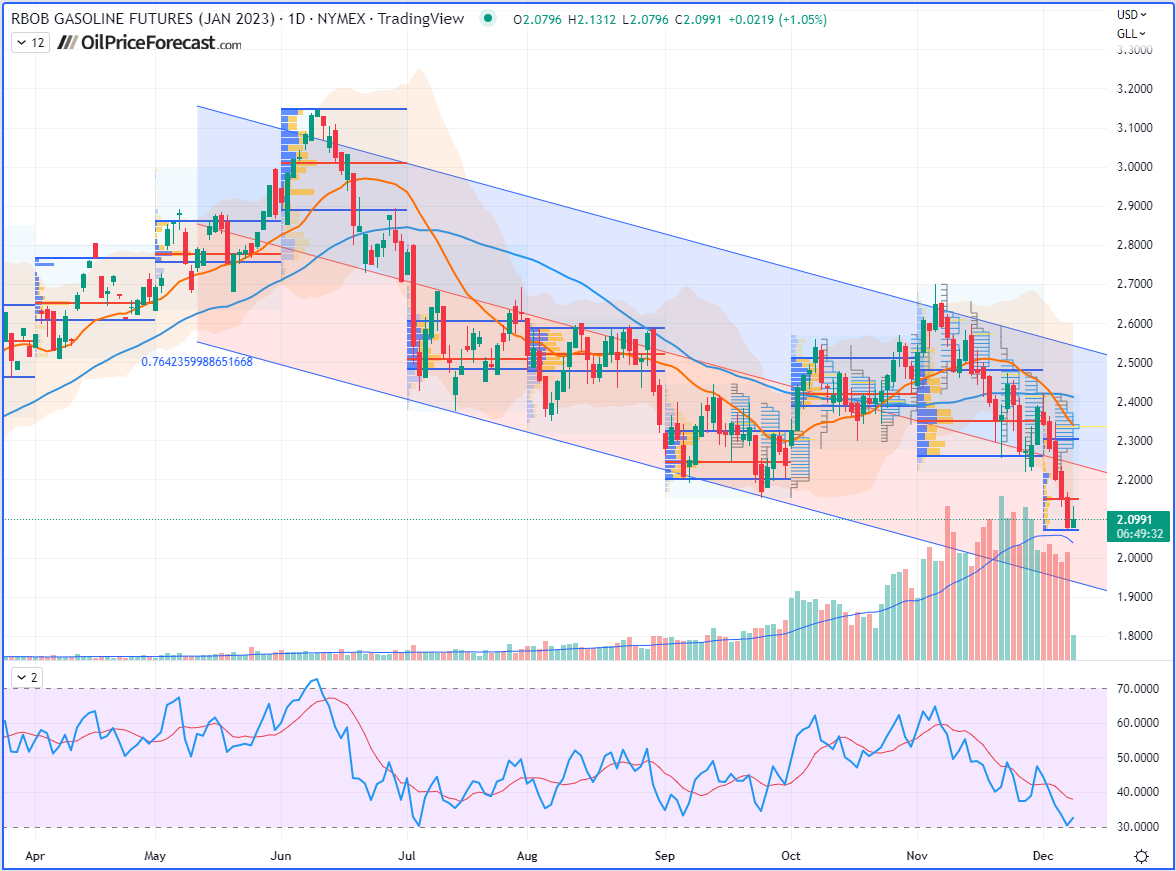
RBOB Gasoline (RBF23) Futures (January contract, daily chart)
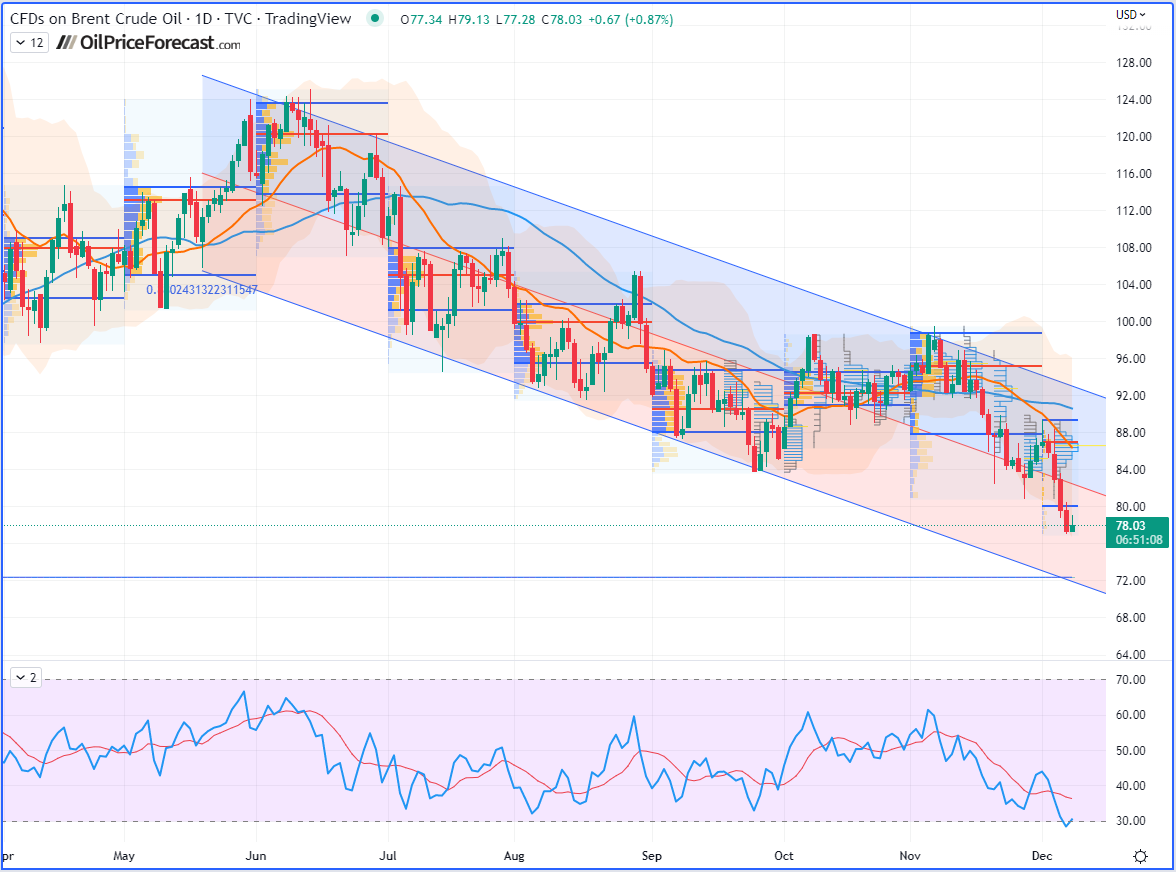
Brent Crude Oil (BRNG23) Futures (February contract, daily chart) – Contract for Difference (CFD) UKOIL
That’s all for today, folks! Happy trading!
More By This Author:
What Will Upcoming OPEC+ Mean For Oil Prices?How Did The Rocket Explosion In Poland Affect The Oil Market?
What the USDX Shows Will Happen To Oil Soon
Disclaimer: All essays, research and information found in this article represent the analyses and opinions of Sunshine Profits' associates only. As such, it may prove wrong and be ...
more

