CPI Was A Yawn, What About Oil?
Somewhat befitting of the recent lack of volatility, today’s CPI report proved to be a bit of a snoozer. All the components came in as expected except for the month-over-month core reading, which was 0.3% vs. 0.2%. Stocks and bonds both fell in the immediate wake of the number, but both recovered quickly once traders realized that the miss was largely the result of rounding. It was curious that the year-over-year core reading was as expected at 4.3%, so we did a bit of digging. It turns out that the actual monthly rise was 0.27%, which of course rounds up to the reported 0.3%. Not a big deal in the scope of things.
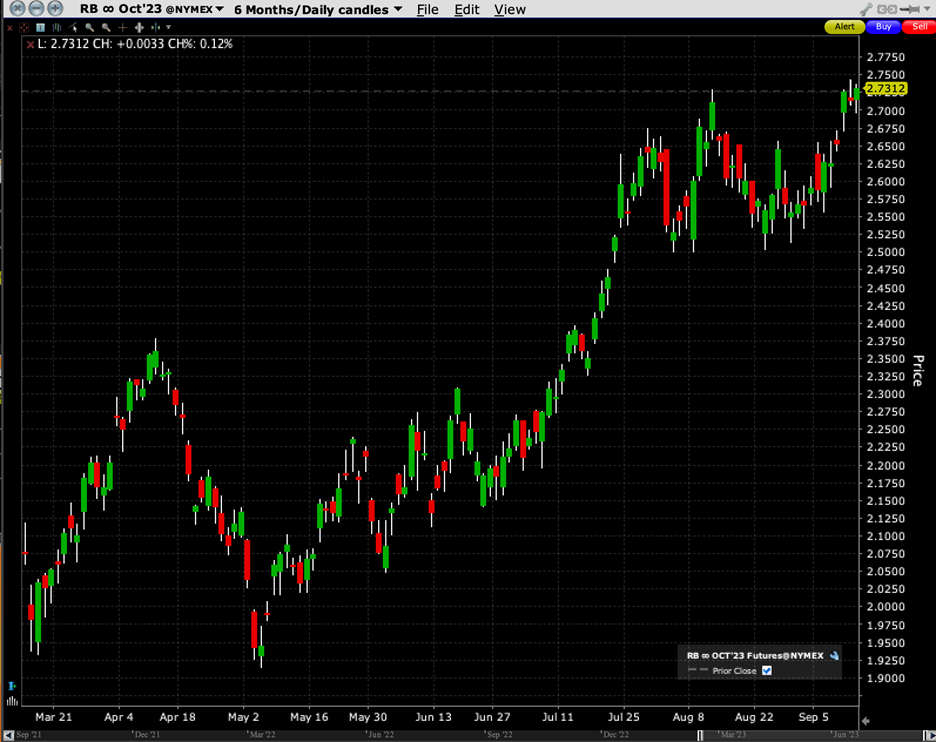
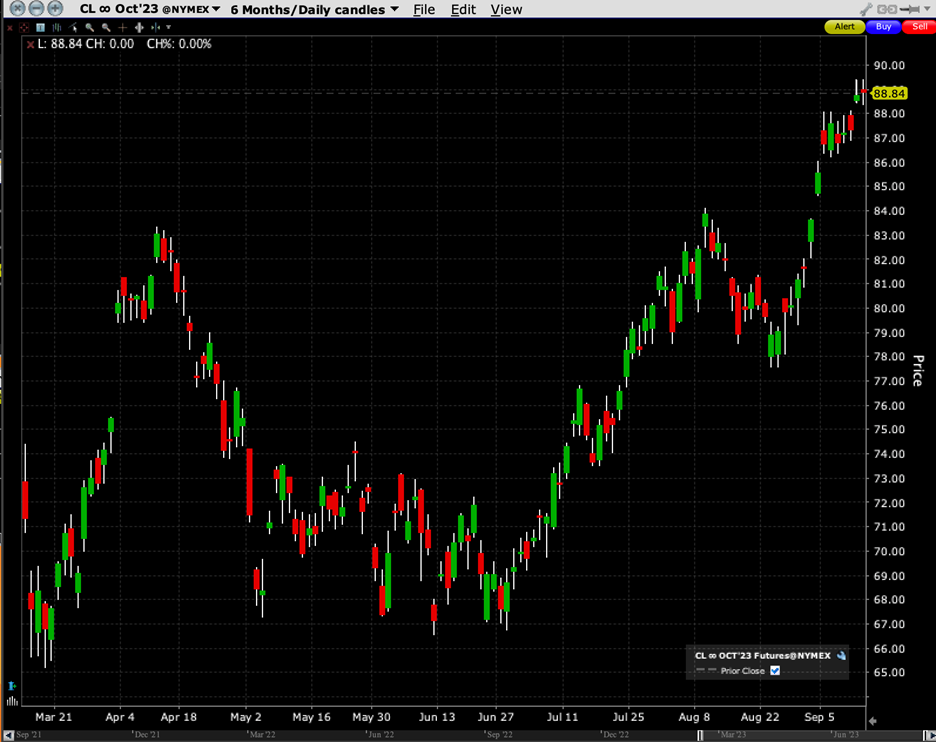
But there is something going on that greatly affects ordinary consumers’ views of inflationary expectations. The price of crude oil has been rising steadily, along with the price of gasoline. True, those are non-core items — core inflation readings strip out volatile food and energy prices –those have a significant impact upon people’s view about future inflation. The following two charts are not particularly helpful for those who are concerned about rising prices:
6-Month Candles, Rolling RBOB Gasoline Futures
(Click on image to enlarge)

Source: Interactive Brokers
6-Month Candles, Rolling NYMEX Crude Oil Futures
(Click on image to enlarge)

Source: Interactive Brokers
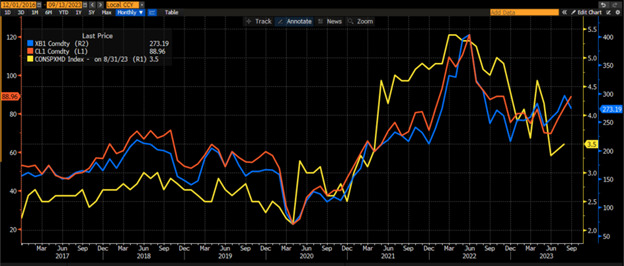
So, should we care that a set of non-core prices are zooming higher? Umm, yes. For starters, most people do, in fact, eat and drive. As a result, ordinary folks often view inflation differently than Federal Reserve economists. The Fed is rightly asserting its vigilance about embedded inflationary expectations. Unfortunately, surveys show that inflationary expectations are highly dependent upon prices at the pump.
Line Chart, Since 2016, Monthly Data: University of Michigan Expected Changes in Prices for 1 Year, Median (CONSPXMD, yellow, near right scale), Rolling RBOB Gasoline Futures (XB1, blue, far right scale), Rolling NYMEX Crude Futures (red, left scale)

Source: Bloomberg
It is quite clear that inflationary expectations, at least the one-year variety measured by the University of Michigan, follow pretty closely with energy prices.If the current rises in oil and gasoline prices persist, this can indeed present a problem for policymakers – even if they focus primarily on core inflation.
The next UMich readings are due on Friday morning, and I don’t have sufficient knowledge of their methodology to know whether the most recent energy price jumps will be incorporated into this week’s data. But looking ahead, if these higher prices persist – always a big “if” – then it might prove premature to declare victory over inflation and assume that lower expectations are built into peoples’ mindsets.
More By This Author:
Complacency Or Correlation?
More About Correlation And VIX
Bond Market Throws a Head Fake
Disclosure: FUTURES TRADING
Futures are not suitable for all investors. The amount you may lose may be greater than your initial investment. Before trading futures, please read the CFTC ...
more


