
The CPI cooled again in December driven by a massive fall in Energy prices. As shown below, the fall in Energy has been a big reason for the recent drop in inflation. Commodities have also been a driver down as Used Cars and Trucks fell -2.5% MoM and -8.8% YoY.
That said, stickier items like Shelter continue to increase.
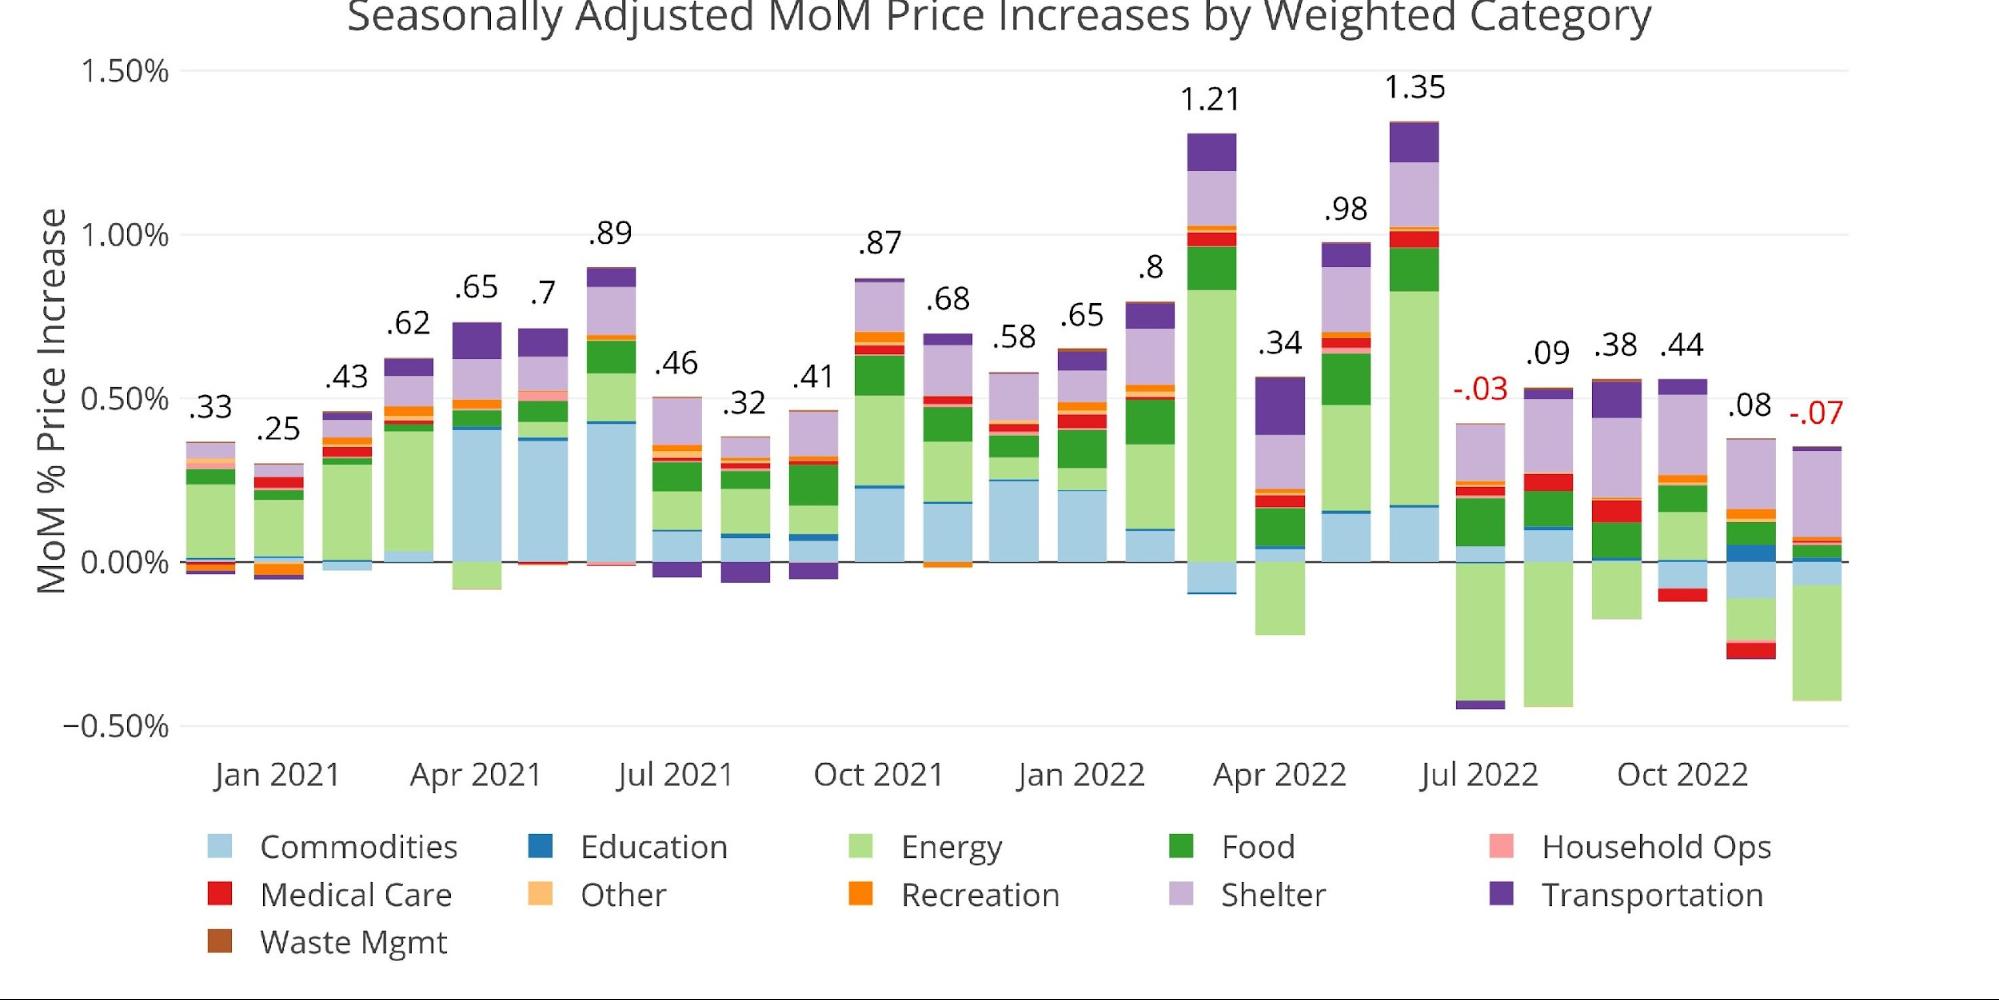
Figure: 1 Month Over Month Inflation
A big driver behind the fall in Energy prices has been the Strategic Petroleum Reserve (SPR). The latest report shows total stockpiles of 371M barrels, the lowest since December 1983 and down 49% from their peak!
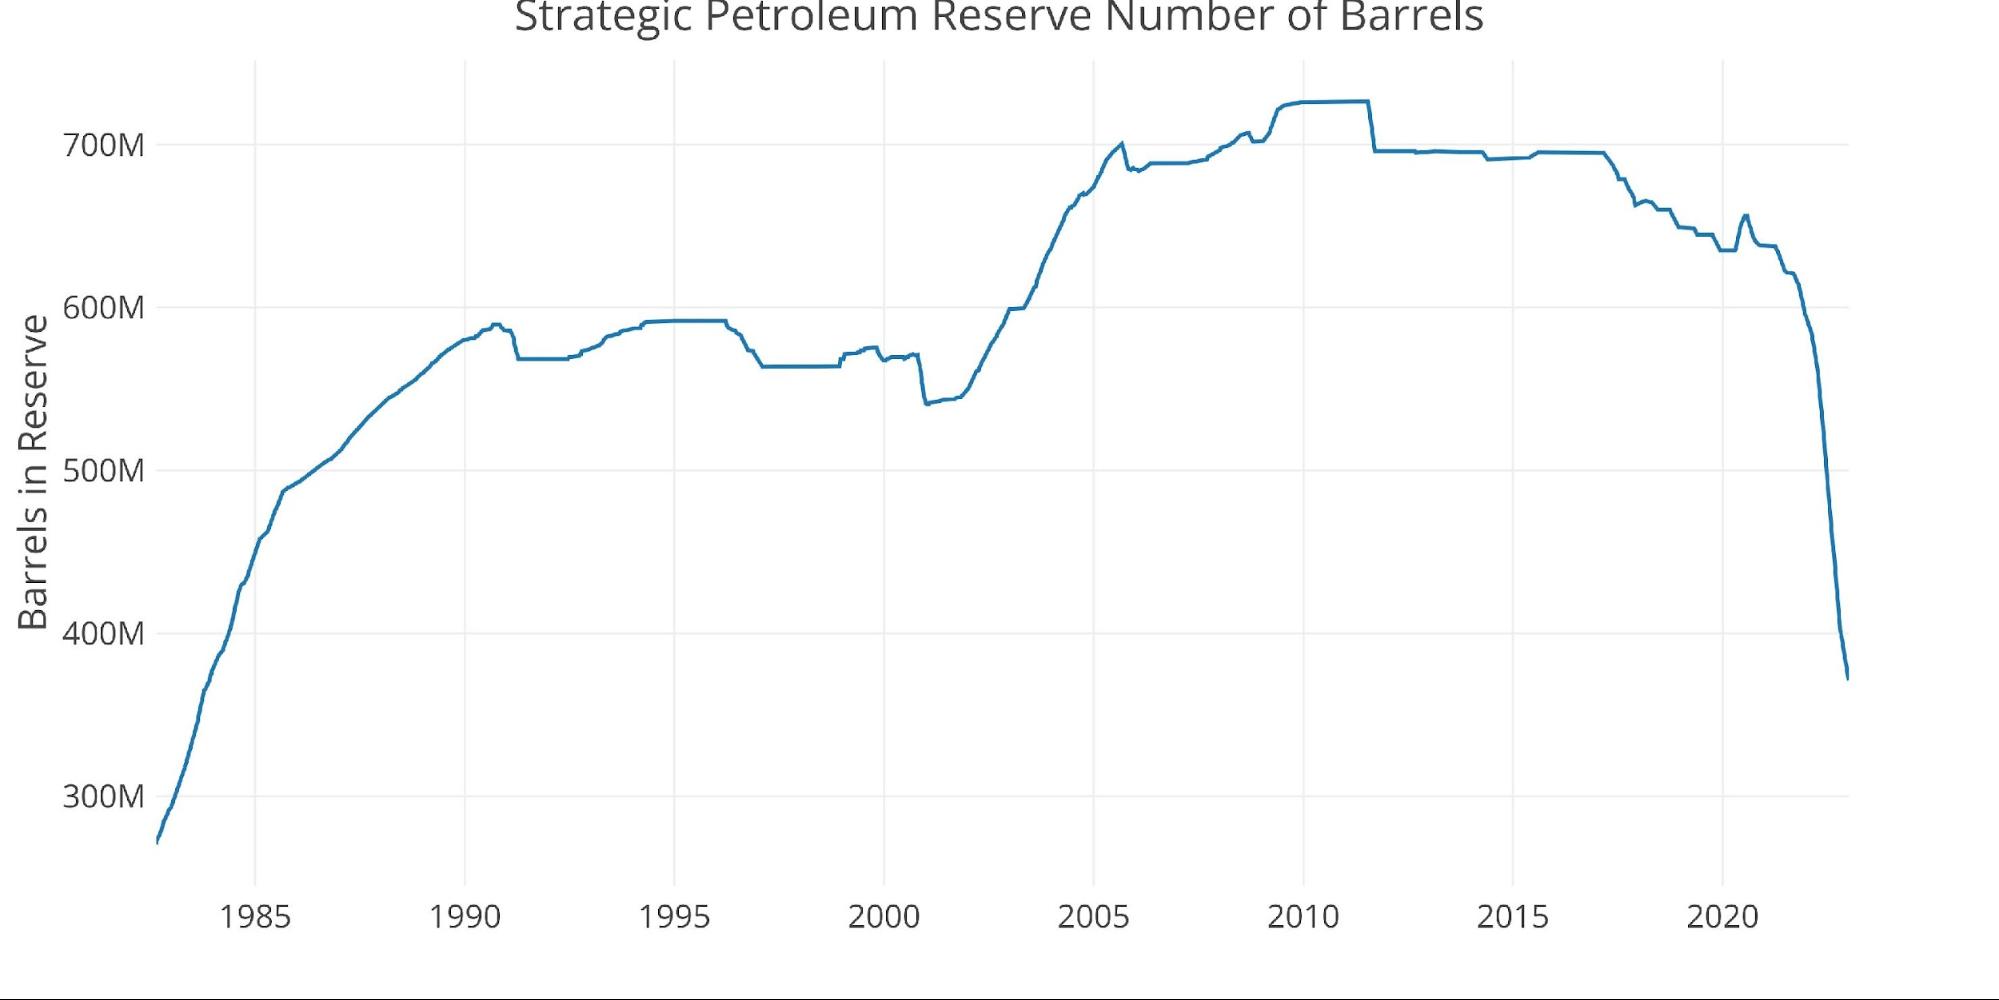
Figure: 2 SPR Inventory
The chart below shows the MoM change in the SPR since Covid started. The big down month was in September, right before the elections (surprise!). Even after the elections and after Energy prices have come down some, the SPR continues to be pillaged, why?
Psychology. The Fed and administration need to keep inflation expectations anchored. Bringing down Energy prices is a major help in alleviating a surge in inflation, which then influences inflation expectations. The hope must be for inflation to come back down before the SPR is completely exhausted.
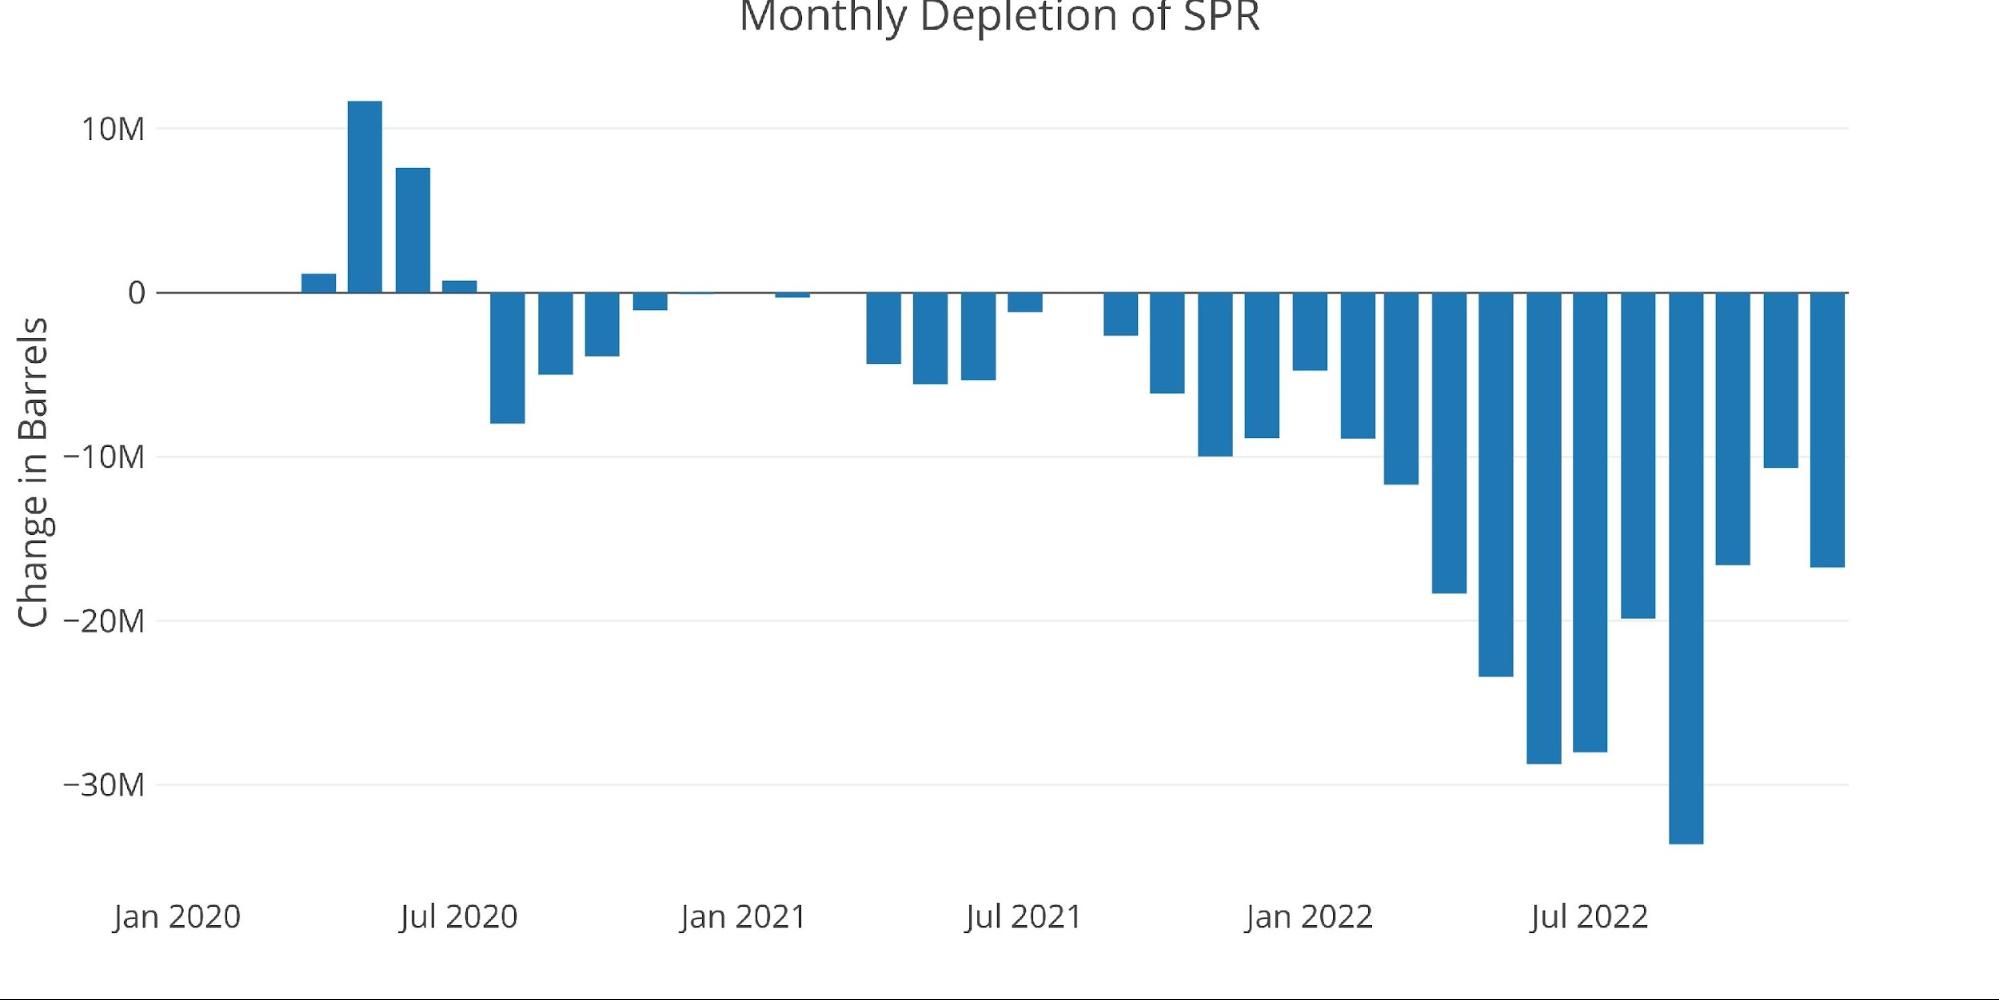
Figure: 3 SPR MoM
When looking at the YoY numbers, it’s clear to see the impact of the fall in Energy. It aligns very nearly with the SPR reduction on a two-month lag.
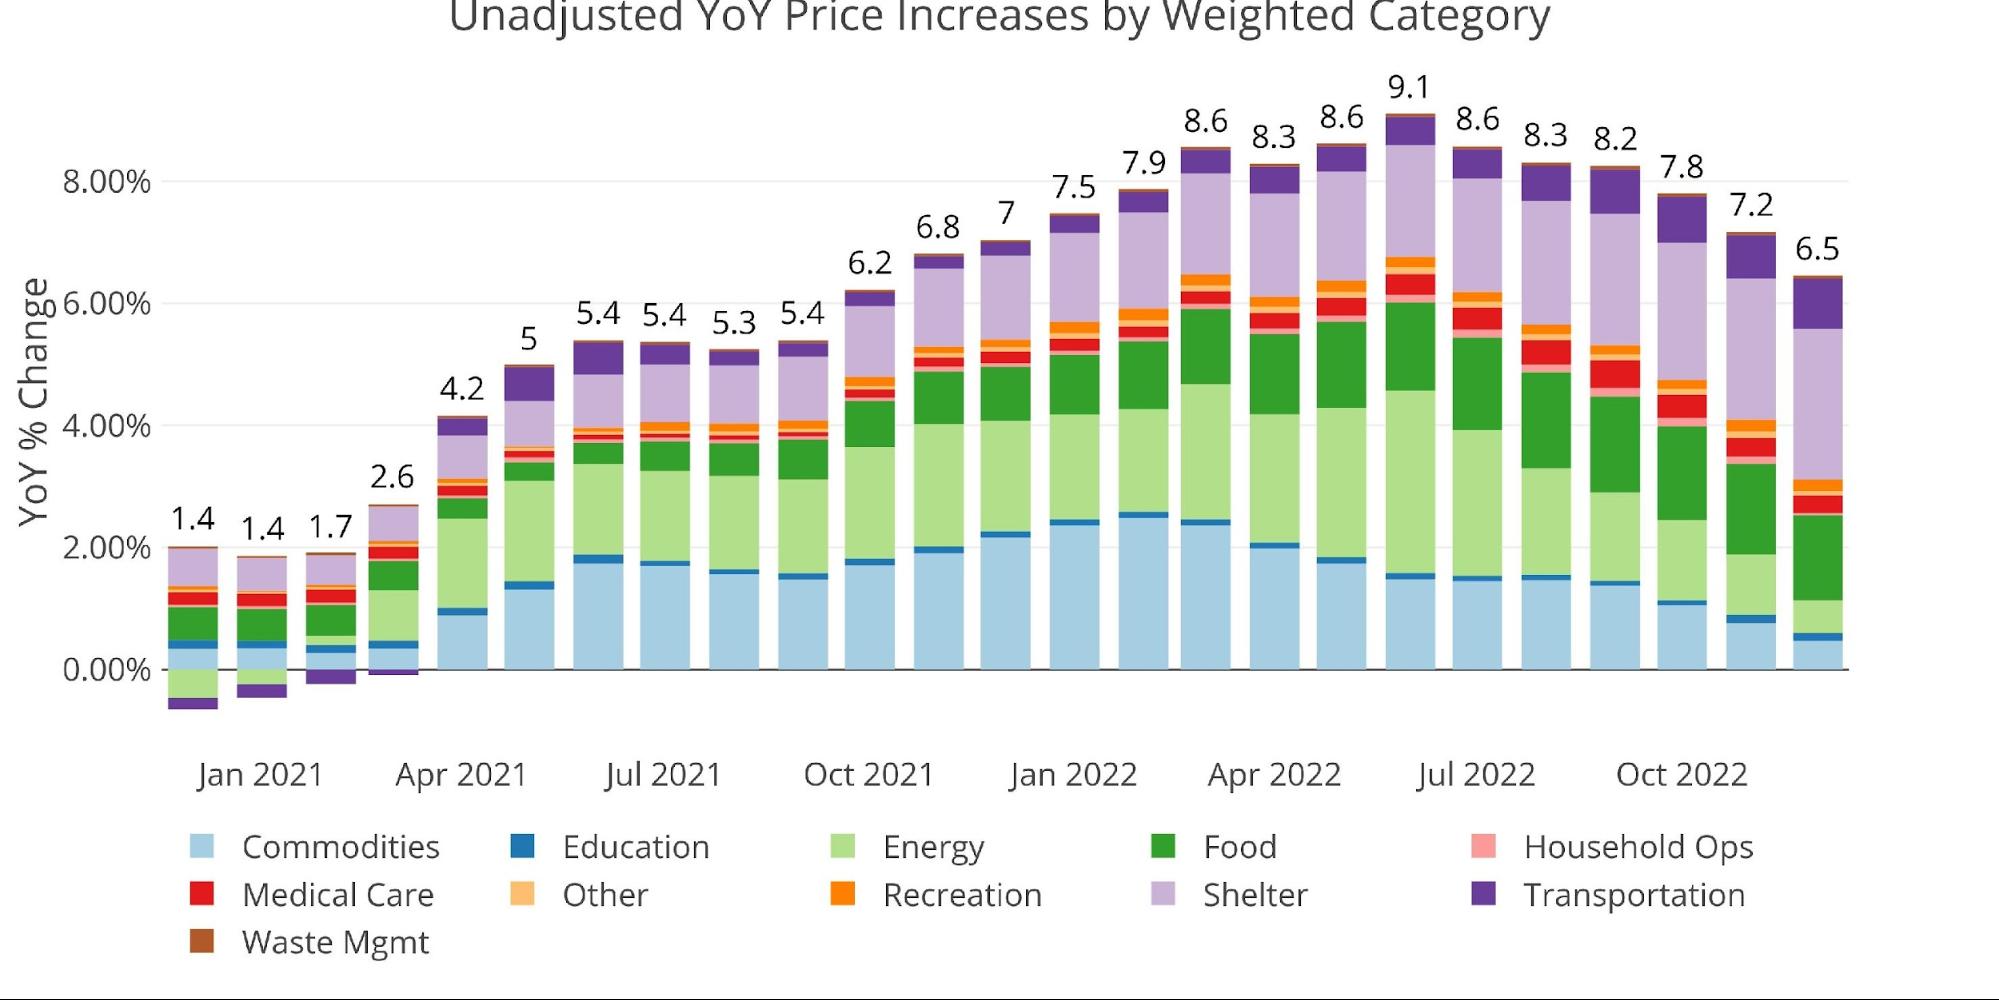
Figure: 4 Year Over Year Inflation
The chart below compares the current month to the 12-month average. Again, the dramatic fall in Energy can be seen here. Only two other categories are negative while the rest continue to trend upward. Three of the categories were even above the 12-month trend, suggesting more inflation is still coming in certain areas.

Figure: 5 MoM vs TTM
The table below gives a more detailed breakdown of the numbers. It shows the actual figures reported by the BLS side by side with the recalculated and unrounded numbers. The weighted column shows the contribution each value makes to the aggregated number. Details can be found on the BLS Website.
Some key takeaways:
-
- Energy contributed -0.35% of the -0.15% fall
-
- This means without Energy; the CPI was up by 2%
-
- MoM Shelter was up 0.8% which annualizes to 10%
-
- This is finally in line with market rates, which were showing double-digit increases a year ago!
- YoY had Shelter contribute 2.5% to the 6.45%. This means even if everything else went to zero, Shelter would still be rising fast enough to bring the CPI above the Fed’s 2% target
-
- Energy contributed -0.35% of the -0.15% fall

Figure: 6 Inflation Detail
Looking at the Fed Numbers
While the Fed does have different categories (e.g., Energy is in transportation), their aggregate numbers match the BLS.
Housing, Apparel, and Education are above the 12-month trend.
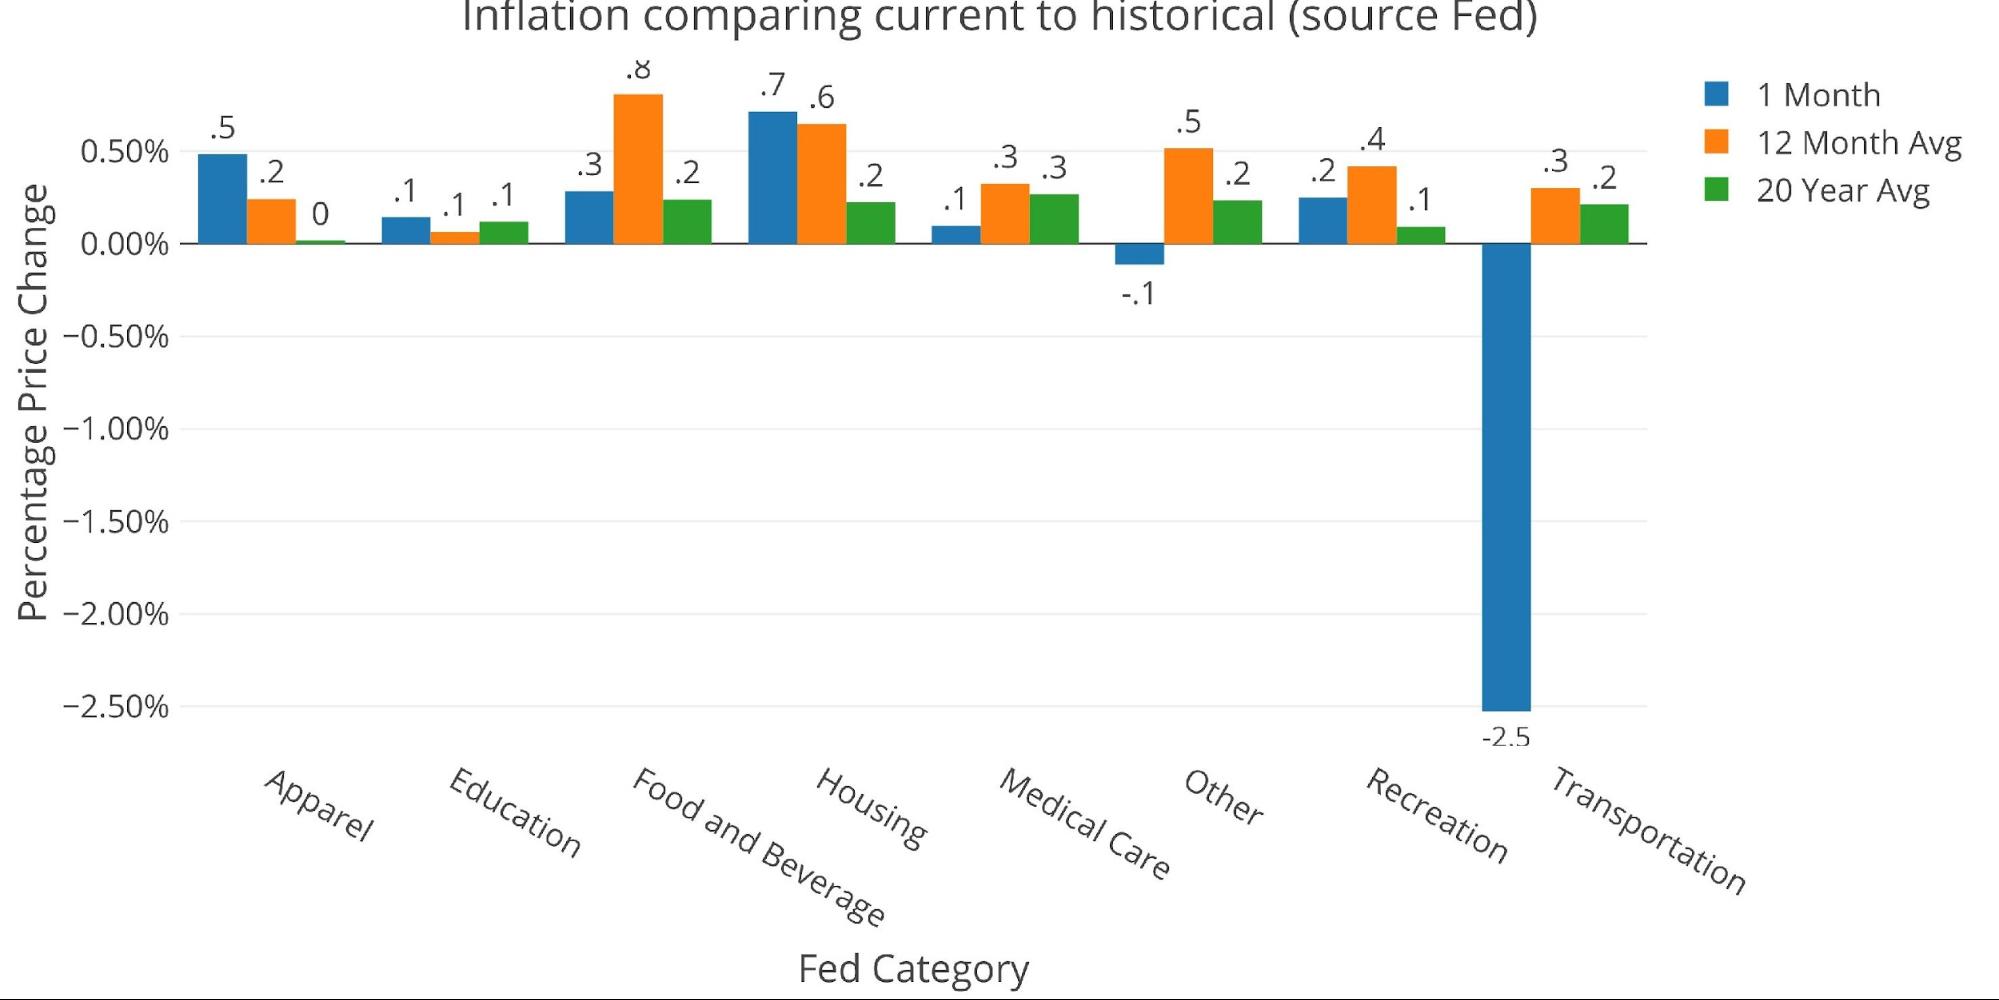
Figure: 7 Current vs History
Fed Historical Perspective
Taking a longer look at the CPI produces the chart below. As can be seen, the mistake made by the Fed in the past has been to lower the Fed Funds rate (gray line) just as inflation started coming down. While Powell was unable to get rates up very high, he is committed to not easing too soon.
When a drop in inflation was followed by lower rates, inflation would turn right back up again. These lags played out over several years. This means the Fed has to keep rates elevated for a longer period of time and cannot immediately cut rates once inflation drops. If it moves too soon, inflation will come back even bigger.
The problem is that the Fed does not have years to regain its credibility. The current environment cannot handle these high rates and almost everyone is assuming a recession is coming in 2023. This means that if history is any guide when the Fed eases in response to market turmoil, they should expect inflation to pick right back up. If the Fed doesn’t ease… well then, the GFC will look like a hiccup compared to the storm brewing in a significantly more levered economy.
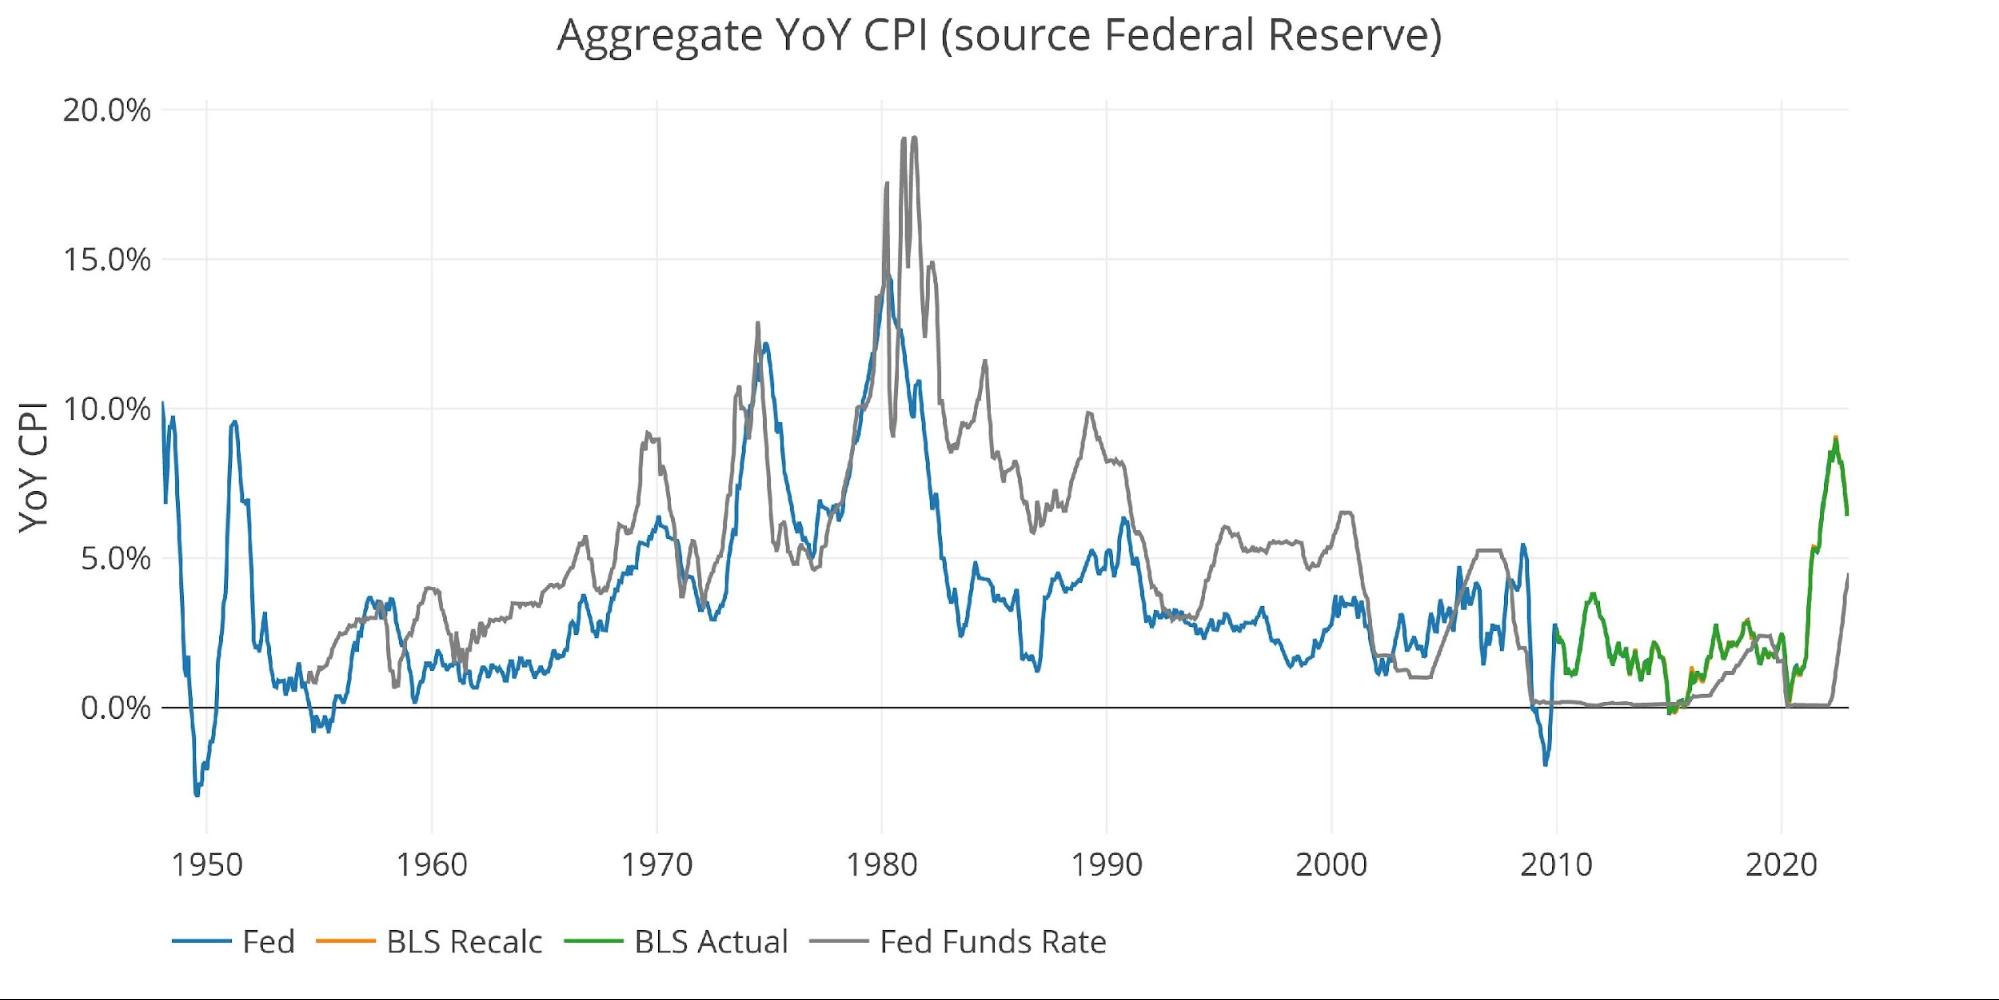
Figure: 8 Fed CPI
BLS Historical Perspective
The BLS weightings have only been scraped back to 2012, thus the chart below shows the past 10 years of annual inflation data, reported monthly. It cannot show the spikes of the ’70s and 80’s shown in the Fed data above.
As mentioned, although the spike has reversed somewhat, it will take a lot more work to get the CPI readings back below 2%. Inflation has been above 4% since April 2021. With the relief in Energy mostly in the rearview mirror, what are the other categories that could drop enough to bring inflation back in line?
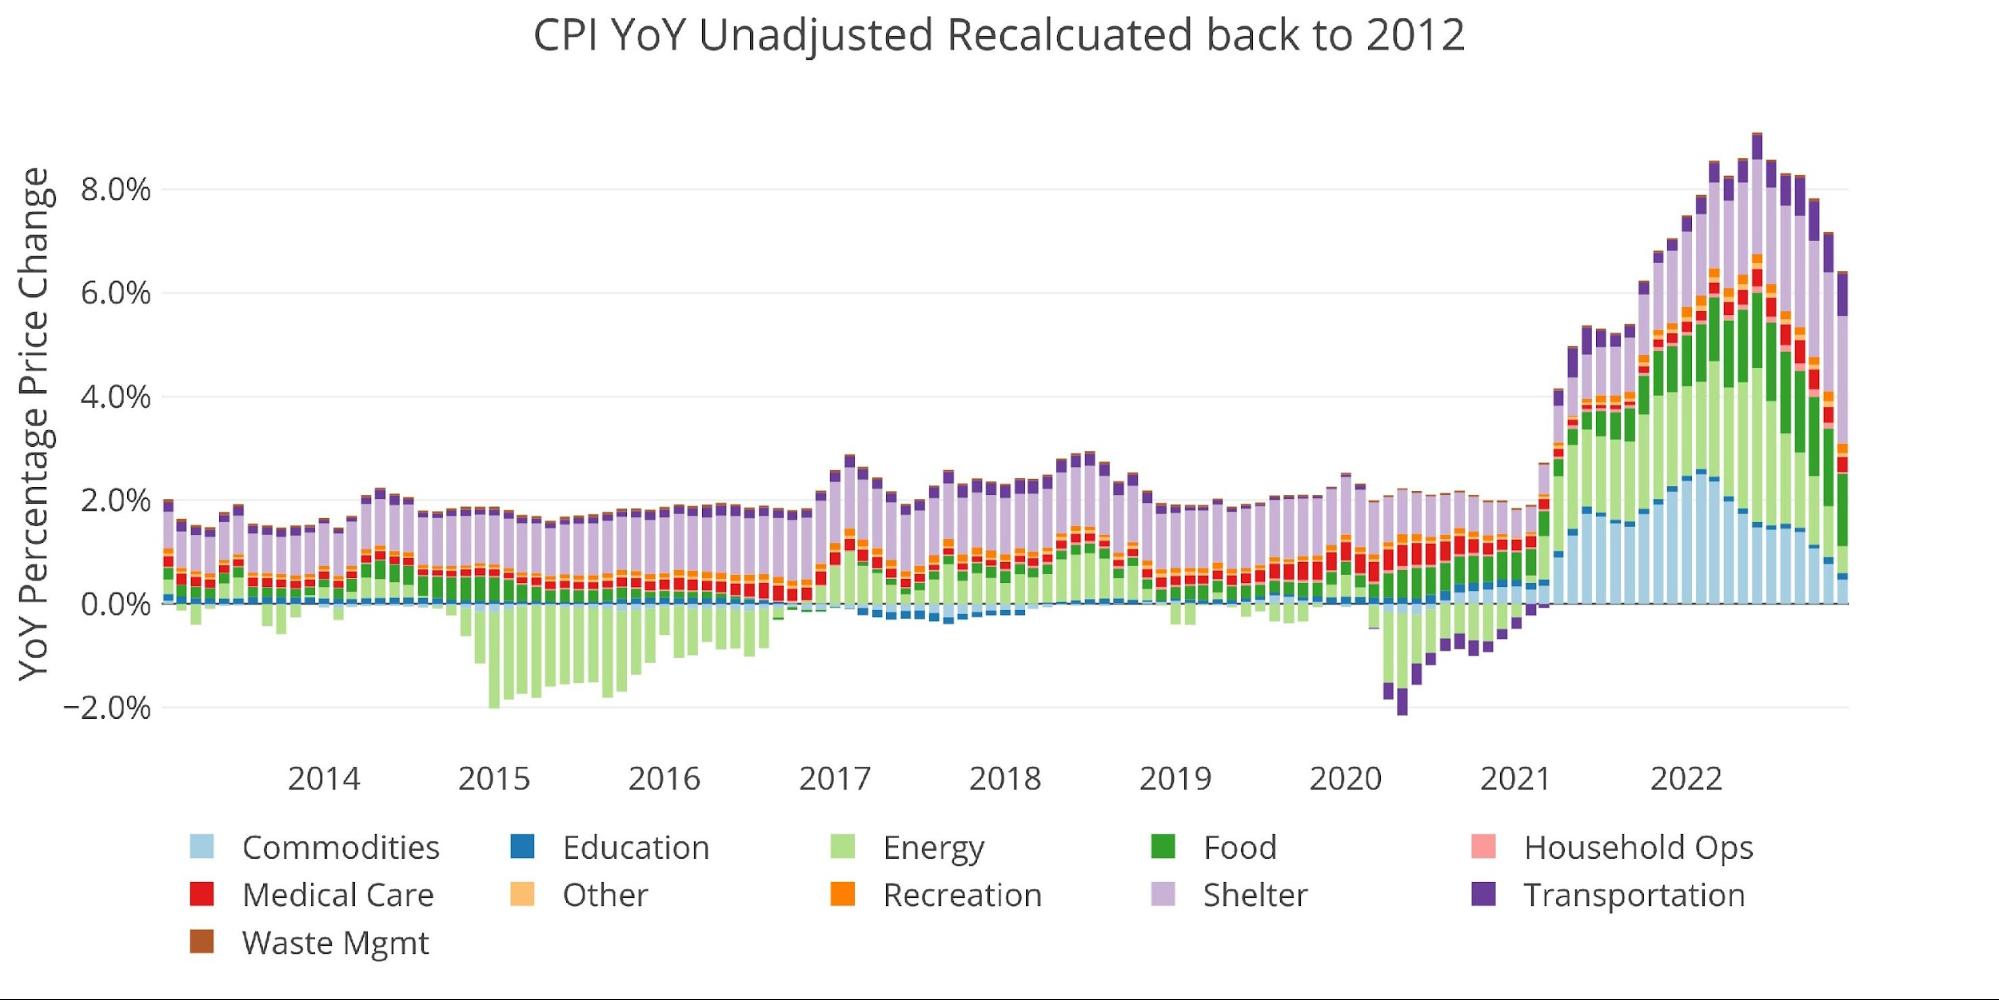
Figure: 9 Historical CPI
What it means for Gold and Silver
December 2021 saw inflation at 7.04% YoY and December 2022 showed 6.45%. This translates to a 14% rise in prices in 2 years after compounding. The Fed cannot undo that damage, the best they can do is make future damage less bad. But 14% still hurts a lot!
Unfortunately, the Fed can only do so much without crushing the economy. Their hands are tied. When something blows up in 2023, they will come to the rescue. Instead of undoing the 14% damage, they will undo the meager progress they have made over the last 6 months. Furthermore, the SPR will not be a source of relief because it will have been depleted (for political reasons).
Gold jumped today on the inflation news. Lower inflation is “good for gold” as the Fed can theoretically pull back on hikes. Pretty soon it won’t matter though. When the Fed reverses course, people will realize the Fed has no other alternative BUT inflation. That is when high inflation prints will send gold higher and low inflation prints will bring prices down. That is when you will know the market has figured it out.
Data Source: https://www.bls.gov/cpi/ and https://fred.stlouisfed.org/series/CPIAUCSL
More By This Author:
Is “Cooling” CPI Setting The Stage For More Inflation?
Is “Cooling” CPI Transitory?
Bill Introduced In Alaska House Would Exempt Gold And Silver From Sales Tax

Comments
Log in or sign up to join the conversation.